Don't Miss Out On Great Gains! - Best Investment Newsletter


Click for FREE sample of Kirk Lindstrom's Investment Letter

Don't miss out! Subscribe Now

google.com, pub-7001134751860982, DIRECT, f08c47fec0942fa0

Search For More

Thursday, March 31, 2011

Gold/Silver Price Ratio Plunges Below 27-Year Low

Update 7/29/13:

With silver prices continuing to make new highs while gold has not made a new high, the gold:silver price ratio plunged to a new low dating back to 1983!

The gold-to-silver price ratio, defined as the price of an ounce of gold divided by the price of an ounce of silver, closed Monday at 37.99. This means an ounce of gold is now less than 40 times more expensive than an ounce of silver.

Charts of the gold-to-silver price ratio, GLD, SLV, Gold and Silver prices plus the rest of my Seeking Alpha article at:

Current Holdings: Personally, I own a very small amount of gold hidden in the house for bribes if we see Armageddon. I also own silver coins for a similar purpose. For inflation protection, I own individual TIPS "treasury inflation protected securities" and Series I-Bonds. I recently sold my managed TIPS mutual funds (FINPX and VIPSX) after the recent surge in TIPS had the spread for the 5-year near record negative lows.  If the base rate for 5-year TIPS returns to a positive level, I may buy the TIPS ETF TIP rather than the managed funds I recently sold.


To best prepare for Armageddon, I own a


MSR MiniWorks EX Microfilter
I can use this to make drinking water from all the swimming pools and hot tubs near me plus the creek around the corner.  I can then trade the drinking water for food and fuel if my extra supplies in my "earthquake kit" run out.

.


Full List of Kirk Lindstrom's Articles at Seeking Alpha

Monday, March 28, 2011

Fed May End QE2 Early

Some members of the Federal Reserve are quite worried about inflation and speaking their mind:
Fed Should Consider Curtailing Stimulus Program, Bullard Says
March 28 (Bloomberg) -- St. Louis Federal Reserve Bank President James Bullard said policy makers should review whether to curtail a plan to buy $600 billion in Treasury securities, noting that the U.S. recovery may not need that much stimulus.

“The economy is looking pretty good,” Bullard said to reporters in Marseille, France, on March 26. “It is still reasonable to review QE2 in the coming meetings, especially this April meeting, and see if we want to decide to finish the program or to stop a little bit short,” he said, referring to the second round of so-called quantitative easing.
...
“If the economy is as strong as I think it is then I think it may be reasonable to send a signal to markets that we’re going to start withdrawing our stimulus, and I’d start by pulling up a little bit short on the QE2 program,” Bullard said. “We can’t be as accommodative as we are today for too long, we’ll create a lot of inflation if we do that.”
CPI is above its 2008 level so SS recipients should get a COLA this year, but like most of us who work and pay into SS, the gain will probably be eaten up completely by higher medical insurance costs.
At least most people on SS got a nice, big 5.8% raise in 2009 that they kept when CPI fell while most of the country took pay cuts or got no raises.
It ruins my day just to think how much my own medical insurance went up since that last SS COLA of 5.8%!

Friday, March 11, 2011

Top CD Rates at Largest US Banks

Interest rates are starting to go up on the long end while the short term rates are terribly low. This week's survey or CD rates at the largest US banks shows BofA advertises 2.25% for a 5-year CD with Citibank paying the lowest for 5-years at 2.0%.    Historical CD Rate Graphs

When we did our last survey of rates at the largest banks, a 5-year CD at the largest US Bank, Bank of America, was only 1.40%.  Chase and Citi paid 2.5% and 1.50%, respectively.  

Unfortunately, short term rates remain extremely low.  Thus, I've kept most of my "cash reserves" in high rate savings accounts with the top rate now 1.30% at American Express. See  Best Savings Account Rate Survey  


Top CD Rates at Biggest US Banks

Rank
Bank
CD Rates for $10,000 CD  - APY in %
as of 3/7/11


6- Mo
12 Mo
18-Mo
2-Yrs
3-Yrs
5-Yrs
1
Bank of America (BAC)
0.30
0.60
promo
0.45
0.65
1.01
2.25
2
JP Morgan Chase  (JPM)
0.25
0.60
13-mo
0.50
0.50
1.01
2.25
3
Citibank (C)
0.25
0.50
0.60
0.75
1.01
2.00
4
Wells Fargo Bank (WFC)
0.10
0.15

0.65
25 Mo
0.93
33 Mo
2.15%
58 Mo
5a
HSBC Bank North America -
0.05
0.10
0.20
15-mo
0.35
0.35
0.80
5b HSBC Online Rates
0.10
0.20
0.20
15-mo
0.35
NA NA

US Treasury Rates
0.15
0.22
NA
0.69
1.19
2.18

Click for full size chart

Friday, March 04, 2011

ECRI Global Inflation Numbers Heating Up - Fed Behind the Curve

The Economic Cycle Research Institute, ECRI - a New York-based independent forecasting group, released its latest readings for its proprietary monthly Future Inflation Gauges this morning. (More about ECRI)
Five of the seven regions covered show increasing inflationary pressure with Japan and Australia going against the global trend.
Commenting on the US report, Lakshman Achuthan, co-founder and Chief Operations Officer of ECRI, said, "With the USFIG rising to a 29-month high, underlying inflation pressures remain in a cyclical upswing."
See my exclusive article at Seeking Alpha for a full summary of today's data:
Here is a video interview on CNBC where Lakshman says the Fed has been behind the curve for a decade on inflation.
=================================================
=================================================

Then read my artilce "How to Play Expected Inflation From the TIPS Spread."  The 30-year individual TIPS I recommended in that article for purchase last month on Feb. 17, 2011 are up nearly 5% already.


Also note the IMM says high food prices may be here to stay. 
Record Food Prices May Persist as Economic Growth Boosts Demand, IMF Says

"Elevated food prices could be part of the new reality, says the IMF, as it will take years for farmers to expand production enough to meet increased demand and drive down prices. "The main reasons for rising demand for food reflect structural changes in the global economy that will not be reversed," including higher demand for meat in developing countries, and increased demand for biofuels is contributing to a tightened supply."

I'm not predicting run-a-way inflation, but the Federal Reserve's preferred inflation indicator, the PCE index, went up 0.3% the last two months.  If it continues at that rate for 10 more months, annual inflation will be
  • 0.3% / Month x 12 months = 3.6% per year!
My individual TIPS paying inflation plus 2.1% will then have an effective yield of 5.7% which is pretty good if you expect the Fed to keep rates low for awhile.

Long Term Results that Speak for Themselves
Since 12/31/98 "Kirk's Newsletter Explore Portfolio" is UP 239% (a triple plus another 12%!!)vs. the S&P500 UP only 32% vs. NASDAQ UP only 27% (All through 3/4/11)   
For 2011 , "Kirk's Newsletter Explore Portfolio" is up 8.6% YTD as of 3/4/11
(Currently my explore portfolio has about 66% in equities and 34% in fixed income so the stocks are doing very, very well.)

In 2010, "Kirk's Newsletter Explore Portfolio" gained 20.4% vs. the DJIA up 11.0%
In 2009, "Kirk's Newsletter Explore Portfolio" gained 33.5% vs. the DJIA up 18.8%

  • Subscribe NOW and get the March 2011 Issue for FREE!   
  • Your 1 year, 12 issue subscription will start with next month's issue.

KEY ECRI Articles:

Lakshman Achuthan - Beating the Business Cycle

“This easy-to-read book tells you how the respected ECRI calls turning points, and how you can, too.”
—Jane Bryant Quinn, Newsweek columnist

" The Economic Cycle Research Institute can justify a certain smugness now that business cycles are back in fashion."
--Harvard Business Review

“Shows... how far the state of the art in cycle forecasting has advanced, and how investors can profit from it.”
—Jon Markman, award-winning CNBC/MSN financial columnist 

ECRI's WLI Growth Rate at 42 Week High

The Economic Cycle Research Institute, ECRI - a New York-based independent forecasting group, released its latest readings for its proprietary Weekly Leading Index (WLI) this morning.
For the week ending February 25, 2011:
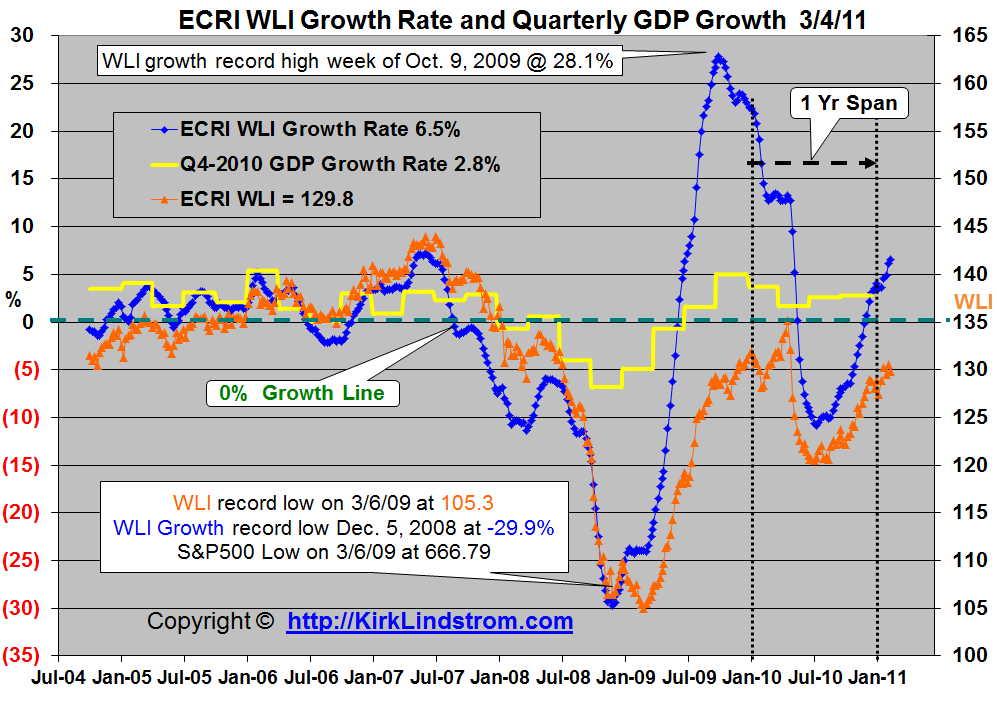
  • WLI is 129.8 down from the prior week's reading of 130.5
  • Last week marked a 42 week high for WLI. Its last higher reading was for the week ending May 7, 2010, when it was at 132.1
  • The lowest reading for WLI on record was 105.3 for the week ending March 6, 2009.
  • WLI growth of 6.5% is up from last week's reading of 6.1%
  • This marks a 42-week high for WLI Growth.
  • The lowest reading for WLI growth on record was -29.9% on December 5, 2008. It turned higher months before the stock market [S&P500 (SPY)] bottomed on March 6, 2009, at 666.79.
On February 13, 2011, Lakshman Achuthan, co-founder and Chief Operations Officer of ECRI was a guest on the national radio show "Moneytalk with Bob Brinker." During the interview with substitute hostess Lynn Jimenez, Mr Achuthan said now was the time to take risk because the economy will get better before it will get worse. He suggested listeners should "Look to take more risk now because we should boom before the next bust." and "get while the getting is good."

Chart of WLI and WLI growth vs GDP Growth
(Click charts to enlarge)

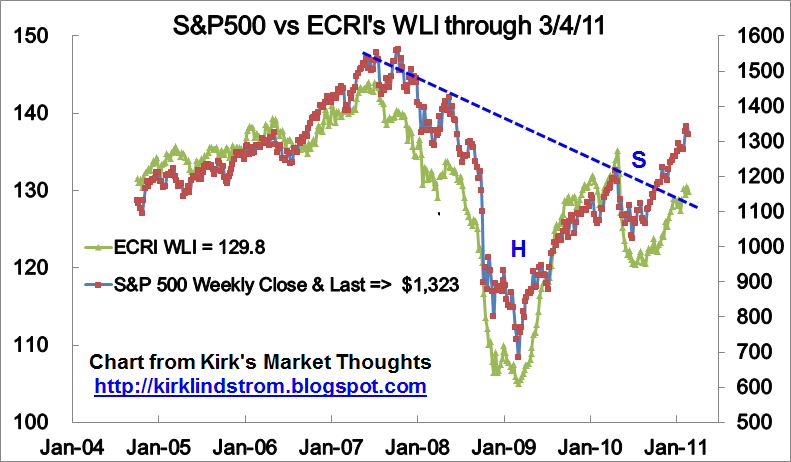
Since ECRI releases WLI numbers for the prior week and the stock market is known in real time, you can sometimes get a clue for next week's WLI from the weekly change in the stock market. Notably, in the lead-up to the last two recessions, the WLI turned down months before the stock market did.
Chart of S&P500 vs ECRI's WLI

I want to point out that a correction in the stock market now would not necessarily change ECRI's call for an economic growth rate revival. It takes a "pervasive" (for the majority) change of direction of indicators in a "pronounced and persistent" way for ECRI to call for a turn in the economic cycle. These indicators and the trigger levels are proprietary. I have found no one who has duplicated them or ECRI's success in calling business cycle turns based on its reading of its indicators.
Note that the chart above of the S&P500 vs. WLI shows a breakout above the dashed blue line that represents the neckline for a "Head and Shoulders Bottom" pattern. This is a very bullish development. A correction to test the pattern from above with a bounce to a higher high would be even more bullish, but not necessary for a continued market advance.
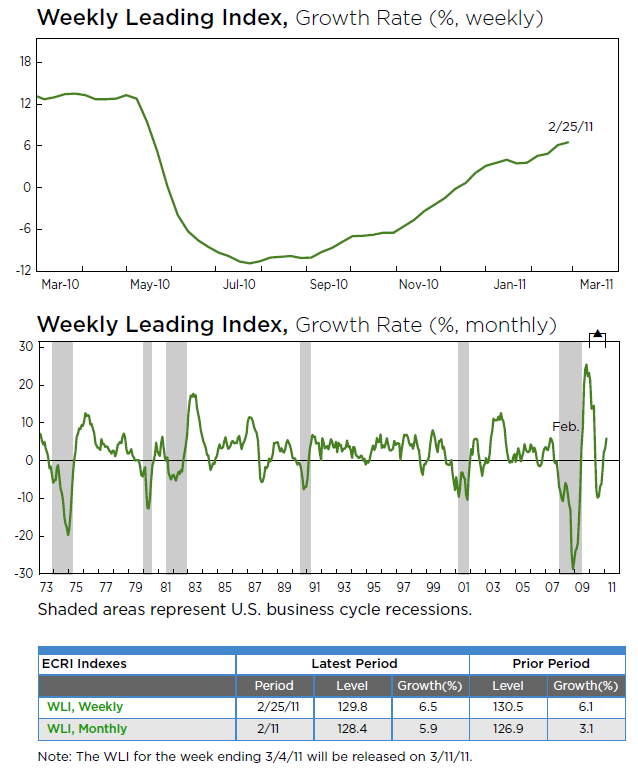
Chart of WLI from 1973 to 2011

How to play ECRI's Signals: I own a lot of small cap stocks in my personal "explore portfolio" so I own SPY to get a more market weighting in this trading portfolio. If I wanted to recommend just one ETF to be long the market and take advantage of ECRI's outlook for an upturn in the business cycle, it would be the Total Stock Market Index (VTI Charts and quote), which has BOTH large and small cap stocks. I also own the total stock market index fund at Vanguard, (VTSMX) as part of my personal core portfolios. Vanguard discourages trading its index funds so VTI is the vehicle of choice for that.
Notes:

  1. Occasionally the WLI level and growth rate can move in different directions, because the latter is derived from a four-week moving average.
  2. ECRI uses the WLI level and WLI growth rate to HELP predict turns in the business cycle and growth rate cycle respectively. Those target cycles are not the same as GDP level or growth, but rather a set of coincident indicators (including production, employment income and sales) that make up the coincident index. Based on two additional decades of data not available to the general public, there are a couple of occasions (in 1951 and 1966) when WLI growth fell well below negative ten, but no recessions resulted (although there were clear growth slowdowns).
  3. For a better understanding of ECRI's indicators, read its book, "Beating the Business Cycle."

KEY ECRI Articles:


Lakshman Achuthan - Beating the Business Cycle

“This easy-to-read book tells you how the respected ECRI calls turning points, and how you can, too.”
—Jane Bryant Quinn, Newsweek columnist

" The Economic Cycle Research Institute can justify a certain smugness now that business cycles are back in fashion."
--Harvard Business Review

“Shows... how far the state of the art in cycle forecasting has advanced, and how investors can profit from it.”
—Jon Markman, award-winning CNBC/MSN financial columnist 

Thursday, March 03, 2011

Fund Flows: Equity, Bond & Money Market Yearly Totals

Equity, Bond & Money Market Fund Flows - Yearly Totals & 2011 YTD
Weekly Data through 03/02/2011     

Equity Fund Inflows $2.3 Bil
Taxable Bond Fund Inflows $2.5 Bil
xETFs -
Equity Fund Inflows $233 Mil
Taxable Bond Fund Inflows $2.5 Bil


Fund Flow Totals by Year & 2011 through 3/2/11 
Table 1 Lipper Fund Flows for Full Year - $B
Fund Flows for Equity Tax Bond MM Fund
2003 40.8 40.7 NC
2004 95.0 11.3 (64.3)
2005 71.9 9.3 89.0
2006 52.5 29.9 308.3
2007 111.3 68.8 569.5
2008 3.5 (3.3) 608.0
2009 6.0 172.0 (280.2)
2010 24.8 148.4 (392.3)
201133.733.4(45.2)
  • NC = Data Not Compiled
  •  += Some data points for Money Market Fund flows between March 2010 and July 14, 2010 are missing but the overall trend is clear. 
  • Raw data from Lipper Weekly Fund Flows Report: 
This table shows a summation of the weekly fund flow data. Money Market funds yield next to nothing so people have taken money out to buy bonds as well as live on during the recession and long recovery period with high US unemployment (9.0%)

ExETFs—For the week ended 03/2/2011 all Equity funds report net inflows totaling $0.233 billion, with Domestic Equity funds reporting net inflows of $0.162 billion and Non-Domestic Equity funds reporting net inflows of $0.071 billion... ExETFs—Emerging Markets Equity funds report net inflows of $0.045 billion...  Net inflows are reported for All Taxable Bond funds ($2.537 billion), bringing the rate of inflows of the $2.797-trillion sector to $5.118 billion/week...  International & Global Debt funds posted net inflows of $0.927 billion...  Net inflows of $0.900 billion were reported for Corp-Investment Grade funds while Flexible Funds reported net inflows of $1.026 billion…  Money Market funds report net inflows of $1.853 billion…  ExETFs—Municipal Bond funds report net outflows of $0.989 billion, their sixteenth consecutive week of outflows... 

Click for full size image

Tuesday, March 01, 2011

Jim Cramer Recommends Gold and Gold Corp.

Update 7/29/13: Today on CNBC's "Street Signs" at about 11:30AM PST Amanda Drury interviewed Jim Cramer for their regular "stop trading" segment.  Gold (Quote and Chart) closed at $1,410.90 per ounce near its all time high.

Jim Cramer was very excited about Gold.  Cramer said
  • "I've been a gold bug since 'Mad Money" began.
  • EVERYONE should have ten to twenty percent of their portfolios in gold.
  • Gold is "extraordinarily poised to go up better than ANY OTHER ASSET in the world."
  • Gold "could see $1,550 very quickly"
  • Gold "could" see $2,000 per ounce within 18 months.
  • "They can't find the stuff."
  • EVERYONE must own gold!
  • "Gold is your antidote to what is going on.... Chaos in Washington.  Chaos in the Middle East."
Today Gold closed at $1,410.90 per ounce near its all time high.
When asked what he liked for a stock pick, Jim recommended Goldcorp (GG).  Jim said he likes GG because of their low p[roduction costs and "ability to find the stuff."

Today GG closed at $49.34, slightly below its all time high
I wonder how many people will add Gold or Goldcorp to their portfolios now near all time record highs based on Jim's advice.

Questions:
  1. Can anyone verify that Cramer has been a gold bug since his Mad Money show began?  
  2. Has Cramer had Gold in his action alerts portfolio for 10 to 20% from the start? 
  3. Was it a small position that grew with the large gain in gold? 
    Or 
  4. did he add Gold recently?
Personally, I own a very small amount of gold hidden in the house for bribes if we see Armageddon, but I own "treasury inflation protected securities" (TIPS) mutual funds (like the ETF TIP or managed funds FINPX, VIPSX) and Series I-Bonds, as well as individual TIPS. I also believe it is a good time to own equities, including SPY, the exchange traded fund for the S&P500, for both inflation protection and income.

The individual 30-yr TIPS I said I was buying in "How to Play Expected Inflation From the TIPS Spread" are up about 6% in just two weeks already. I am not making any predictions for the price of Gold, but individual TIPS bought directly from the US Treasury are safe since they won't lose money if the price of gold crashes.

More Information:

Followers - Click "follow" to get an email alert for new articles

Kirk Lindstrom's Investment Letter Performance