

Intraday "Correction" Statistics for Russell 2000 as of 08/06/14
More Russell 2000 charts and Quote
Last Market High 07/01/14 at 1,213.55=>This means the decline from intraday high to intraday low is 10.8% and we are currently 0.075802398 7.6% off the peak.
Last Market low 08/01/14 at 1,082.53
Current R2000 Price 1,121.56
Decline in Points = 91.99
Decline in percent = 7.6%
Max Decline = 10.8%

From ChartoftheDay.com
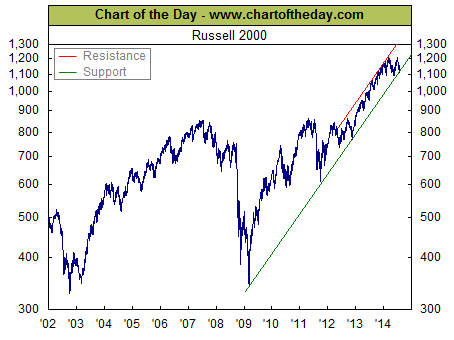
For some perspective on the current state of the stock market, today's chart presents the long-term trend of the Russell 2000 (small-cap stocks). As the chart illustrates, the Russell 2000 rallied from late 2002 into the mid-2007 and then effectively gave all of that back during the financial crisis. Since the financial crisis, the Russell 2000 has been rallying sharply to the upside (with the exception of a brief "fiscal cliff" induced selloff in November 2012). Since early March 2014, however, the Russell 2000 has moved significantly to the downside and is now testing support of its upward sloping, post-financial crisis trend channel.
My Recent FREE Seeking Alpha articles:
- Aug 5 The Dow Economic Sentiment Index Supports A Higher Market
- July 28 SPY Sets Another Record High While ECRI's WLI Is Just Below A 6.3-Year High


 kirklindstrom.com

No comments:
Post a Comment