Wednesday, October 31, 2012

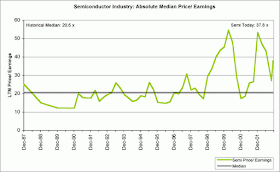
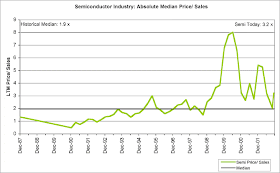
Historical Semiconductor Valuation Charts

I found these Historical Semiconductor Valuation Charts from 1987 to 2002 on my hard drive under:
C:\Users\Kirk\Documents\Kirk's Documents\Investments\Historical Info\Valuation Graphs


Now compare those valuations to today's valuation for a few stocks I follow in my newsletter.


Valuation Measures
Market Cap (intraday)5:13.09B
Enterprise Value (Oct 31, 2012)3:12.96B
Trailing P/E (ttm, intraday):12.70
Forward P/E (fye Oct 30, 2013)1:14.30
PEG Ratio (5 yr expected)1:1.85
Price/Sales (ttm):1.42
Price/Book (mrq):1.58
Enterprise Value/Revenue (ttm)3:1.40
Enterprise Value/EBITDA (ttm)6:6.92
http://finance.yahoo.com/q/ks?s=AMAT+Key+Statistics


Valuation Measures
Market Cap (intraday)5:6.36B
Enterprise Value (Oct 31, 2012)3:4.92B
Trailing P/E (ttm, intraday):49.10
Forward P/E (fye Jun 24, 2014)1:10.40
PEG Ratio (5 yr expected)1:0.77
Price/Sales (ttm):2.20
Price/Book (mrq):1.27
Enterprise Value/Revenue (ttm)3:1.70
Enterprise Value/EBITDA (ttm)6:11.99
http://finance.yahoo.com/q/ks?s=LRCX+Key+Statistics

Valuation Measures 
Market Cap (intraday)5:108.51B
Enterprise Value (Oct 31, 2012)3:106.35B
Trailing P/E (ttm, intraday):9.47
Forward P/E (fye Dec 31, 2013)1:11.03
PEG Ratio (5 yr expected)1:0.86
Price/Sales (ttm):2.04
Price/Book (mrq):2.23
Enterprise Value/Revenue (ttm)3:1.98
Enterprise Value/EBITDA (ttm)6:4.59


Valuation Measures 
Market Cap (intraday)5:9.68B
Enterprise Value (Oct 31, 2012)3:7.25B
Trailing P/E (ttm, intraday):16.88
Forward P/E (fye Dec 31, 2013)1:15.97
PEG Ratio (5 yr expected)1:1.42
Price/Sales (ttm):5.41
Price/Book (mrq):2.98
Enterprise Value/Revenue (ttm)3:4.03
Enterprise Value/EBITDA (ttm)6:11.18

I saved those graphs because in late 2002 it looked like the sector was bottoming and I was a big buyer.  As it turned out, the market did bottom in late 2002 and then tested the bottom in 2003 but many of the stocks I bought in 2002 were much higher by the March 2003 test of the 2002 bottom.


Do you think history will repeat here?


Thursday, October 25, 2012

Facebook Lock-up Expiration Schedule

A timetable for the end of the lock-up period for Facebook shares

I am working on an article for Seeking Alpha that explains this table in detail but I wanted to post the table for an article I wrote called " Facebook: Dan Niles Now Long After Covering His Short Position."

See  FB Facebook Stock Share Lock-up Expiration Timetable


My guess is Dan Niles is playing a bounce in stock price and will be out before the date showing 53.6% of the shares hit the market next month.


If he wanted to buy more shares for his hedge fund right after it jumped 20%, then why would he tell a large audience it was a good value?


Personally, I would not touch the stock with Dan's ten foot pole until after 95% of the shares are released for sale.

"Witnessing the Republicans and the Democrats bicker over the U.S. debt is like watching two drunks argue over a bar bill on the Titanic."   Kirk Lindstrom
Learn the "Core and Explore" approach to investing
with "Kirk Lindstrom's Investment Letter"
Subscribe NOW and get the October 2012 Issue for FREE!  
(Your 1 year, 12 issue subscription will start with next month's issue.)

Tuesday, October 16, 2012

Social Security COLA for 2013

Today the Social Security Administration announced the cost-of-living adjustment (COLA) for 2013. Here are the details from the Press Release:

Social Security Announces 1.7 Percent Benefit Increase for 2013

Monthly Social Security and Supplemental Security Income (SSI) benefits for nearly 62 million Americans will increase 1.7 percent in 2013, the Social Security Administration announced today.

The 1.7 percent cost-of-living adjustment (COLA) will begin with benefits that more than 56 million Social Security beneficiaries receive in January 2013. Increased payments to more than 8 million SSI beneficiaries will begin on December 31, 2012.

Some other changes that take effect in January of each year are based on the increase in average wages. Based on that increase, the maximum amount of earnings subject to the Social Security tax (taxable maximum) will increase to $113,700 from $110,100. Of the estimated 163 million workers who will pay Social Security taxes in 2013, nearly 10 million will pay higher taxes as a result of the increase in the taxable maximum.

Information about Medicare changes for 2013, when announced, will be available at www.Medicare.gov. For some beneficiaries, their Social Security increase may be partially or completely offset by increases in Medicare premiums.

The Social Security Act provides for how the COLA is calculated. To read more, please visit www.socialsecurity.gov/cola.


How is a COLA calculated?

The Social Security Act specifies a formula for determining each COLA. According to the formula, COLAs are based on increases in the Consumer Price Index for Urban Wage Earners and Clerical Workers (CPI-W). CPI-Ws are calculated on a monthly basis by the Bureau of Labor Statistics.

COLA Computation

The last year in which a COLA became effective was 2011. Therefore the law requires that we use the average CPI-W for the third quarter of 2011 as the base from which we measure the increase (if any) in the average CPI-W. The base average is 223.233, as shown in the table below.


Also shown in the table below, the average CPI-W for the third quarter of 2012 is 226.936. Because this average exceeds 223.233 by 1.7 percent, the COLA effective for December 2012 is 1.7 percent. The COLA calculation, with the result rounded to the nearest one-tenth of one percent, is:
(226.936 - 223.233) / 223.233 x 100 = 1.7 percent.


  CPI-W for—
2011 2012
July 222.686 225.568
August 223.326 227.056
September 223.688 228.184
Third quarter total 669.700 680.808
Average (rounded to the nearest 0.001) 223.233 226.936

Friday, October 12, 2012

DJIA Adjusted For Inflation - DOW Historical Chart

This chart shows the DOW, Dow Jones Industrial Average, adjusted for inflation.
Click for full size image
Click charts for full size images


For commentary and my current market outlook, read "Kirk's Investment Newsletter"


Wednesday, October 03, 2012

Timer Digest - Top Ten Timers List

This Saturday, "Kirk Lindstrom's Investment Letter" made the "Top Ten Timer's List" in the "Timer Digest hotline for Saturday September 29."  Scroll down to #6 (sixth place) to see my name.  Learn more about Timer Digest here.

Timer Digest monitors over 100 of the leading market timing models, ranking the top stock, bond, and gold timing according to the performance of their recommendations over various periods of time.
  • Commentary by Top Ranked Market Timers, know who they are and their current market opinions.
  • Commentary by Top Ten Stock Market Timers
  • Commentary by Top Long Term Stock Market Timers
  • Commentary by Top Bond Timers
  • Commentary by Top Gold Market Timers
Here is an excerpt from the Timer Digest hotline email:

This is the Timer Digest hotline for Saturday September 29. The Dow stands at 13,437.13 down 48.84 on Friday and down 142.34 points for the week. There have been no signal changes, 1 Consensus signal change, and 3 re-alignments since Wednesday's hotline. The Top Ten Consensus is Bullish with 8 Bulls, and 2 Bears.

The Top Long Term Timers are Bullish with 10 Bulls. The Top Bond Timers are now Bullish with 4 Bulls, and 1 Neutral. And, the Top Gold Timers are Bullish with 4 Bulls, and 1 Neutral. Now the comments of the Top Timers.


  1. xxxx of yyyy ....  is on a September 26, Buy signal. He said the market may rally with support from a positive divergence and favorable seasonality in the week ahead.
  2. xxxx of yyyy .... , is on a June 5, Buy signal. He expects generally higher prices into late October, and brief corrections along the way.
  3. xxxx of yyyy .... is on a September 13, Sell signal. He predicted the market may establish a tradable low in the first half of October.
  4. xxxx of yyyy .... is on a June 15, Buy signal. He said the market should benefit from the recent, better relative performance by small-cap stocks.
  5. xxxx  ....  is on a September 21, Sell signal. He said sentiment and speculation indicators reveal a worrisome complacency among investors.
  6. Kirk Lindstrom of Kirk Lindstrom's Investment Letter is on a May 17, 2011 Buy signal. He suspects that softer economic data may give the market an excuse to pullback and generate another buying opportunity.
  7. Bernie Schaeffer of Schaeffer's Daily Bulletin is on a September 25, 2009 Buy signal. He suggested that equities may hesitate in response to weaker reports on the domestic economy.
  8. James Stack of Investech Research is on a May 13, 2008 Buy signal. He said technical evidence is favorable even though economic conditions have been mixed.
  9. xxxx of yyyy ....  is on a July 20, 2007 Buy signal. He remains constructive; though concerned about mediocre valuation gauges.
  10. xxxx of yyyy .... is on an August 20, Buy signal. He said slow, but ongoing, economic growth should continue to support an uptrend for stocks.
click to see larger image

The bulletin goes on to explain changes to their model portfolios:
There is 1 change for the ETF program. On Monday, one-third of the money market fund balance will be used to bid for....
Learn more about Timer Digest here.

For about two years, I have been posting my Timing Signals on my web site for free and Timer Digest (TD) has tracked my signals.  I also send TD my monthly newsletter so they can see how I use a mixture of stock selection, asset allocation, technical analysis, fundamental analysis and market timing to manage "Kirk Lindstrom's Explore Portfolio."

Long Term Results that Speak for Themselves
Since 9/30/98 inception, "Kirk's Newsletter Explore Portfolio" is UP 394%
vs. the S&P500 UP only 82% vs. NASDAQ UP only 84% (All through 9/30/12)
8.8% Compound Annual Return vs. 1.5% for the S&P500
(More Info, Testimonials & Portfolio Returns)

Tuesday, October 02, 2012

Tax Cuts Explained with Beer

Suppose that every day, ten men go out for a beer and the bill for all ten comes to $100.

If they paid their bill the way we pay our taxes, it would go something like this:
  • The first four men (the poorest) would pay nothing.
  • The fifth would pay $1.00
  • The sixth would pay $3.00
  • The seventh would pay $7.00
  • The eighth would pay $12.00
  • The ninth would pay $18.00
  • The tenth man (the richest) would pay $59.00

So that's what they decided to do. The men drank in the bar every day and seemed quite happy with the arrangement, until one day the owner threw them a curve.


"Since you are all such good customers," he said, "I'm going to reduce the cost of your daily beer by $20.00."

Drinks for the ten men now cost just $80.00.

The group still wanted to pay their bill the way we pay our taxes, so the first four men were unaffected. They would still drink for free. But what about the other six men - the paying customers? How could they divide the $20 windfall so that everyone would get their "fair share?"

They realized that $20.00 divided by six is $3.33. But if they subtracted that from everybody's share, then the fifth man and the sixth man would each end up being paid to drink his beer. So, the bar owner suggested that it would be fair to reduce each man's bill by roughly the same amount, and he proceeded to work out the amounts each should pay.

And so:
  • The fifth man, like the first four, now paid nothing (100% savings).
  • The sixth now paid $2 instead of $3 (33% savings).
  • The seventh now paid $5 instead of $7 (28% savings).
  • The eighth now paid $9 instead of 12 (25% savings).
  • The ninth now paid $14 instead of $18 (22% savings).
  • The tenth now paid $49 instead of $59 (16% savings).
  •  

Each of the six was better off than before! And the first four continued to drink for free. But once outside the restaurant, the men began to compare their savings.

"I only got a dollar out of the $20" declared the sixth man. He pointed to the tenth man, "But he got $10!"

"Yeah, that's right," shouted the seventh man. "Why should he get $10 back when I got only two? The wealthy get all the breaks!"

"Wait a minute," yelled the first four men in unison. "We didn't I get anything at all. The system exploits the poor!"

The nine men surrounded the tenth and beat him up.

The next night the tenth man didn't show up for drinks, so the nine sat down and had beers without him. But when it came time to pay the bill, they discovered something important. They didn't have enough money between all of them for even half of the bill!

And that, boys and girls, journalists and college professors, is how our tax system works. The people who pay the highest taxes get the most benefit from a tax reduction. Tax them too much, attack them for being wealthy, and they just may not show up anymore. In fact, they might start drinking overseas where the atmosphere is somewhat friendlier.

For those who understand, no explanation is needed.

For those who do not understand, no explanation is possible.