Monday, February 27, 2017

Warren Buffett's Top Holdings for 2017 - Berkshire Hathaway BRKA

On Saturday February 25, 2017 Warren Buffett released his 2017 Annual letter to shareholders for his Berkshire Hathaway (BRKA) performance through December 31, 2016.  I wrote a detailed article about this for Seeking Alpha you can read at:
Summary:
Buffett Listed 3 stocks of note with prices within 6% of his average purchase price.
He did not add to two top holdings that went down in 2016, an up year for the market.
Apple was a new position for 2016.
Any short-term market pullbacks to the average price Buffett paid could be a buying opportunity to do better than Buffett.
Holdings as of 12/31/16 from 2017 Shareholder letter:

Holdings as of 12/31/15 from 2016 Shareholder letter:

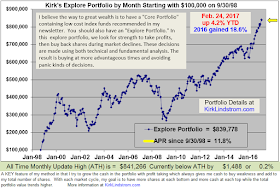
My Core and Explore Performance vs Warren Buffett's BRKA:

Kirk Lindstrom's Investment Letter:
Subscribe NOW & get the February 2017 Issue for FREE!!!


I'll use this article to add additional charts people request in comments here.

2/27/17 4:01 PM PST Update
  • According to Jim Cramer, on CNBC this morning Buffett said he now owns 133 million shares of Apple, making it equal to his holdings in Coke!  
2/28/17 7:09 AM PST Update:  
  • Doc Hopey wrote in the comments section of my article: "I am often impressed about the confidence regarding the depth of a moat. "Apple has a much bigger moat than IBM". How can you be so sure? I'd remember a lot of stocks in the tech business, that I guess I'd thought having a strong moat. Blackberry, Nokia, Kodak, Polaroid, Yahoo... Most of those have been (nearly) gone long before I started investing. Nonetheless in the rearview mirror all of those brands lost their mojo for technical revolutions. (Mostly) All of those consumer brands are gone and I am not sure if I would have gotten that right. Not so IBM."
Apple vs Sony Graph


Saturday, February 25, 2017

Market Update - Eleven Straight Days of Dow Records

Market Update for Saturday February 25, 2017
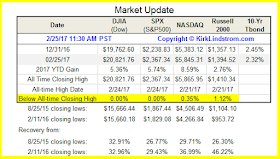
  • The Dow closed at a record high for 11 days in a row!!! 
  • Sentiment via my CPC and 2cs charts is getting extreme
  • It is nice that when you take profits you can get up to 2.38% in CDs (See CD Rate Survey) and 1.25% in savings (See Savings Account Rate Survey) 
  • Click images to see full size
This chart shows closing values for the markets by day.  Note how I highlight the numbers if they made a new record high.  
Led by the Nasdaq, this chart shows the markets are up between 2.76% and 8.59% YTD:

Long-term Dow & S&P500 charts:


The Russell 2000 small cap index is up over 46% in just over a year.  
These two short-term timing charts suggest caution now.
Do you have a list of stocks and ETFs you will use new cash or profit taking dollars for buying any major declines?

Some of the stocks I bought back a year ago when we had the last double digit decline (like FDX & LRCX) have done VERY well and I've taken profits to lock in huge gains.
Some Emailed Buy Alerts to my Subscribers Last Year
Kirk Lindstrom's Investment Letter:
Subscribe NOW & get the February 2017 Issue for FREE!!!


Friday, February 24, 2017

Tesla Double Bottom Breakdown with Next Five Support Levels TSLA

Tesla Double Bottom Breakdown - Support levels, listed below, range from $60 to $241.
Stock markets YTD graph also.

Support Levels:
  1. MA(50) = 50-day moving average at $240.11
  2. MA(200) = 200-day moving average at $216.58
  3. PNF Point & Figure blue support line at $188
  4. Lower dashed red support line at $155
  5. Open Gap around $60

Kirk Lindstrom's Investment Letter:
Subscribe NOW & get the February 2017 Issue for FREE!!! 
 Stock Markets YTD


Saturday, February 11, 2017

Record Highs All Around

Market Update - US Stock Markets All Made New Record Highs!!! 
On Friday February 10, 2017, all major U.S. stock market indexes closed at new record highs.
Click images to see full size
This graph shows the market data graphically for 2016 YTD.
Irrational Exuberance and Irrational Pessimism Charts:  This two graphs puts the Dow Jones Industrial Average into perspective using a log scale.  
Many pundits on TV say lowering the corporate tax rate will allow hundreds of billions of dollars to return to the US where some will be used for share buybacks.  This buying by companies plus scared bond investors looking for return (as interest rates rise and bond returns crash) could easily drive the Dow back to the center blue line... 
Of course a bear market could also drive it to the lower blue line first so I take profits at new highs to have funds to buy the declines and thus beat the market over time like very few others have.
This graph show new record highs for my newsletter Explore Portfolio also. 
Kirk Lindstrom's Investment Letter:
Subscribe NOW & get the February 2017 Issue for FREE!!!