Wednesday, December 26, 2018

Market Down 20%, Fear is Everywhere & President Trump Says a Great Opportunity to Buy

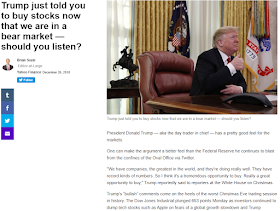
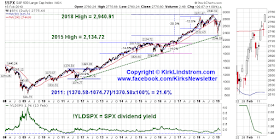
📉💰Currently the S&P 500, down 20.3% from its peak, is sitting on support while the Fear & Green index is at its second day at 2.0, a sign of massive fear. With all that, President Trump told reporters yesterday no Christmas, " So I think it's a tremendous opportunity to buy. Really a great opportunity to buy."  Do you agree?
Chart showing the S&P 500 touching a very strong support line (in green) today:

There is certainly blood in the streets now, especially for the once high flying "FAANG" stocks:
Yesterday on Christmas, President Trump told reporters, " So I think it's a tremendous opportunity to buy. Really a great opportunity to buy."📈💲
We raised a lot of cash when the markets were much higher and other investors were "greedy" and now we have been buying while others are "fearful."  

Is it "The Bottom?"  

Nobody knows for sure but you can see from my long-term S&P 500 chart that the market has corrected 20.3% from its peak all the way down to this very strong support line.


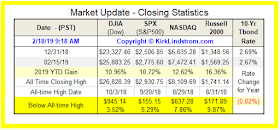
Feb 18, 2019 Update:   President Trump was correct.  It WAS a great time to buy!  I sure did some "Christmas Shopping" and now my Explore Portfolio is at a record high!
Holiday Email List


 Subscribe NOW  and get

the
 January 2019 
Issue for FREE!!!
I've taken some profits so if we test the lows or even retrace some, I have cash to pick up more bargains.  But if the market continues higher, perhaps to make new record highs, then I'l just keep taking profits!  There is an old saying "Bull and bears make money while pigs get slaughtered." 

Discuss this article on my "Investing for the Long Term" Facebook Group here.
.

Tuesday, December 11, 2018

GE: Is $6.66 the Low Like 666 was the 2009 low for the S&P 500?

The market gods have a strange sense of humor.  Note how GE's low today was $6.66, the number of the beast.
More GE Charts
Those who don't believe in market gods will say the market makers like to show their power in "devilish" ways.... 

Note how they used 666 to turn the very large S&P 500 market back in 2009 to make the bottom of the financial collapse.
Mythology has "666" as "The Number of the Beast" so it makes an attractive target for those with a sense of humor.  
From Wikipedia
The S&P 500 and the Nasdaq are down double digits in "correction territory while the Dow is down 9.2% from its all-time high.  


So, 
  1. does GE have a devil's chance of avoiding bankruptcy
    or is it dead man walking? 
  2. did "666" mark the "stealth bear market" bottom again?

February 18, 2019 Update:  It turns out $6.66 was the low last year!


More GE Charts

I bought GE (and some other stocks like AMAT) near that low last December which has helped my Explore Portfolio continue its great outperformance with "only" two thirds in the market so I have plenty of cash for buying opportunities such as GE last December.


More AMAT Charts


 Subscribe NOW  and get

the
 February 2019 
Issue for FREE!!!


Discuss this article on my "Investing for the Long Term" Facebook Group here.

Tuesday, December 04, 2018

US Treasury Yield Curves for 2018 by Kirk

Many blame the stock markets' huge decline today on worries the yield curve (Figure 1) will fully invert. Inverted yield curves often, but not always, precede recessions. Just today the markets fell between 3.1% and 4.4% as Figure 2 below shows.  

Generally the larger the inversion the higher the odds of a recession in the next year.  
Fig 1
Today's Market Action
Fig 2
You can see from the graph above and table below that short term rates are higher than on 9/28/18 while intermediate to long term rates have fallen which is what has to happen before the yield curve inverts.  
Fig 3
A "healthy" yield curve has rates increasing with term from one month to thirty years which we do not have now.

The yield curve is reflecting fear the "Trump Trade War" will push the country into a recession.  
Fig 4
Link to Tweet

The Stock markets, as this table shows, are down between 6.7% and 15.0% below their recent, all time peak values with the Russell 2000 small cap index down the most!
Fig 5
Don't miss out on the next buy or sell alert! 

Fig 6
Fig 7
Yield Curve Definition from Wikipedia


Saturday, December 01, 2018

Investors Intelligence Sentiment Data & 2CS vs S&P 500

Investors Intelligence Sentiment : Bulls / (Bulls+Bears) vs S&P 500 11/30/18

Sentiment is down considerably from the record highs it made early in the year when the stock market was at its peak.
 

Chart of Investors Intelligence Sentiment SurveyBulls / (Bulls+Bears) vs S&P500
Click Graphs for Full Size Images
Market Update

 Subscribe NOW  and get
the
 November 2018 
Issue for FREE!!!

The 2CS is doing nicely too after another great buy signal

My Last article: New Series I Bond Rates

More info at 
Investors' Intelligence Sentiment Indicator

Saturday, November 03, 2018

New Series I Bond Rates - November 2018 through April 2019

On Monday 11/1/18 the Bureau of the Public Debt announced earnings rates for Series I Savings Bonds and Series EE Savings Bonds, issued from November 1, 2018 through April 30, 2019.

Series I bond, or iBond, fixed rates are determined each May 1 and November 1. Each fixed rate applies to all I-bonds issued in the six months following the rate determination. 


The Current I Bond Composite Earnings Rate is 2.83% with a base rate of 0.50%, the highest base rate in ten years!  The Top Rate for older i Bonds is 5.96%!  (See Rates for Older Series I Bonds)


Series EE Savings Bonds will earn 0.10% per year. "All Series EE bonds issued since May 2005 earn a fixed rate in the first 20 years after issue. At 20 years, the bonds will be worth at least two times their purchase price. The bonds will continue to earn interest at their original fixed rate for an additional 10 years unless new terms and conditions are announced before the final 10-year period begins."
===================

For more about how I Bond Rates are calculated and the new rates for older iBonds, see:

My advice: I am not a fan of Series EE savings bonds and have other recommendations in my newsletter for 100% safe, fixed income investing. I happily answer questions about fixed income and my other recommendations via email from my subscribers if what I write isn't clear or if you have something not covered and want my opinion. 
Disclaimer: I own Series I Bonds in my personal account (some have base rates of 3.0%!  I also currently have them in my Newsletter Explore Portfolio.  

Source:  Fiscal Service Announces New Savings Bonds Rates, Series I to Earn 2.83%, Series EE to Earn 0.10%
 Subscribe NOW  and get
the
 October 2018 
Issue for FREE!!!

Wednesday, October 31, 2018

State Street Investor Confidence Index Near 6-Year Low

Today State Street said their Investor Confidence Index fell 3.4 points to 84.4.  This is the lowest reading since December 2012 when it was 81.4

Graph: State Street Investor Confidence Index vs the S&P 500 

  • “As major stock indices were hitting record highs near summer’s end, there were signs that institutional investors were reducing risk exposure,” commented Froot. “As we’ve progressed into fall, equities have declined further as the VIX has doubled. In the US, this month’s sell-off erased all 2018 year-to-date equity market gains, and amid concerns about high valuations and whether earnings may have peaked, some market participants seem to be anxious over a prolonged period of risk aversion.” 
  • “The sharp downgrade our Investor Confidence Index recorded in September was one of the few early warning signs of the ensuing market turbulence that has followed. Confidence has fallen further in October and is more widespread, especially in Europe where not only are political risks rising, but growth is disappointing too. The main difference this month is that the Investor Confidence Index is no longer alone in pointing to potential vulnerabilities; business and consumer confidence are also beginning to wobble too,” commented Michael Metcalfe, head of global macro strategy, State Street Global Markets.
  • A reading of 100 is neutral; it is the level at which investors are neither increasing nor decreasing their long-term allocations to risky assets.
Graph: State Street Investor Confidence Index vs the DJIA
Graph: State Street Investor Confidence Index vs the Nasdaq
  • The index is released globally at 10 a.m. Eastern time in Boston on the last Wednesday of each month. More information on the State Street Investor Confidence Index is available at http://www.statestreet.com/ideas/investor-confidence-index.html. 
  • pdf: Investor Confidence Declined in October by 3.4 Points to 84.4
 Subscribe NOW  and get
the
 October 2018 
Issue for FREE!!!

According to State Street,
 "The Investor Confidence Index was developed by Kenneth Froot and Paul O’Connell at State Street Associates, State Street Global Exchange’s research and advisory services business. It measures investor confidence or risk appetite quantitatively by analyzing the actual buying and selling patterns of institutional investors. The index assigns a precise meaning to changes in investor risk appetite: the greater the percentage allocation to equities, the higher risk appetite or confidence. A reading of 100 is neutral; it is the level at which investors are neither increasing nor decreasing their long-term allocations to risky assets. The index differs from survey-based measures in that it is based on the actual trades, as opposed to opinions, of institutional investors."
Regional Data:

11/1/18 Update:  Fear and Greed Index shows a similar outlook.

x

Monday, October 29, 2018

FB- Facebook Inc. - Fibonacci Technical Analysis

Currently Facebook (FB charts) at $144.68 is sitting just above the 38.2% Fibonacci retracement level that spans the run from its all time low of $17.55 to its all-time high of $218.62.  From below, "After an advance, chartists apply Fibonacci ratios to define retracement levels and forecast the extent of a correction or pullback."
Click Image to see full size

This 35% decline is the largest decline since Facebook fell 53.8% just peaking at $38 after its 2012 IPO then crashing to $17.55 a few months later.
Last Blog Article:
More Info:
  • Fibonacci number
  • Fibonacci Retracements are ratios used to identify potential reversal levels. These ratios are found in the Fibonacci sequence. The most popular Fibonacci Retracements are 61.8% and 38.2%. Note that 38.2% is often rounded to 38% and 61.8 is rounded to 62%. After an advance, chartists apply Fibonacci ratios to define retracement levels and forecast the extent of a correction or pullback. Fibonacci Retracements can also be applied after a decline to forecast the length of a counter-trend bounce. These retracements can be combined with other indicators and price patterns to create an overall strategy.

 Subscribe NOW  and get
the
 October 2018 
Issue for FREE!!!

Wednesday, October 24, 2018

Market Update & Sentiment Charts After Major Sell-off

Keep checking back as I add sentiment charts over the next few hours.

Markets YTD


Fear & Greed Index Closes at 6


2CS

Keep checking back as I add sentiment charts over the next few hours.

From Lakshman Achuthan at ECRI "Economic Cycles & Stock Price Corrections"

What is interesting about ECRI's growth rate downturn is it highlights periods of caution, but the market usually ended up higher before the "all clear" signal rang.  That is why I was active in taking profits at the market highs this year:


Then AFTER big declines, I add shares.

Click "Follow" to get email updates or subscribe to my newsletter to get the most important announcements and investment information.
 Subscribe NOW  and get
the
 October 2018 
Issue for FREE!!!

Update 10/25/18 7:02AM PST
AAII Bulls/Bears Sentiment Chart:
Update 10/25/18 9:10AM PST
CPC Ratios