Thursday, September 29, 2022

FZDXX Yield vs Time

 Historical Fidelity Money Market Fund Premium Class FZDXX Yield


Kirk Lindstrom's Investment Letter

To see what stocks and ETFs are on my buy list and what are my price targets:
 Subscribe NOW  and get
the
 September 2022 
Issue for FREE!!!
(If you mention this ad)

More about FZZDXX From Fidelity

Fund Overview

Objective

Seeks as high a level of current income as is consistent with preservation of capital and liquidity.

Strategy

The Adviser invests the fund's assets in U.S. dollar-denominated money market securities of domestic and foreign issuers, U.S. Government securities, and repurchase agreements. The Adviser also may enter into reverse repurchase agreements for the fund. Investing more than 25% of its total assets in the financial services industries. Potentially entering into reverse repurchase agreements. In buying and selling securities for the fund, the Adviser complies with industry-standard regulatory requirements for money market funds regarding the quality, maturity, liquidity and diversification of the fund's investments. The Adviser stresses maintaining a stable $1.00 share price, liquidity, and income.

Risk

You could lose money by investing in a money market fund. Although the fund seeks to preserve the value of your investment at $1.00 per share, it cannot guarantee it will do so. The fund may impose a fee upon the sale of your shares or may temporarily suspend your ability to sell shares if the Fund's liquidity falls below required minimums because of market conditions or other factors. An investment in the fund is not insured or guaranteed by the Federal Deposit Insurance Corporation or any other government agency. Fidelity Investments and its affiliates, the fund's sponsor, have no legal obligation to provide financial support to the fund, and you should not expect that the sponsor will provide financial support to the fund at any time. Foreign securities are subject to interest rate, currency exchange rate, economic, and political risks. Interest rate increases can cause the price of a money market security to decrease. A decline in the credit quality of an issuer or a provider of credit support or a maturity-shortening structure for a security can cause the price of a money market security to decrease.

Additional Disclosures

This description is only intended to provide a brief overview of the mutual fund. Read the fund's prospectus for more detailed information about the fund.

Initial offering of Premium Class shares for Fidelity Money Market Fund was on 04/06/2015. Returns and expenses prior to that date are those of Fidelity Money Market Fund (SPRXX). Had Fidelity Money Market Fund-Premium Class expenses been reflected in the returns shown, total returns would have been higher.

Fidelity is voluntarily reimbursing a portion of the fund's expenses. If Fidelity had not, the returns would have been lower.

Friday, September 23, 2022

Biden Barometer - Stocks, Oil & Natural Gas Prices During Biden's Term

 9/23/22 #BidenBarometer

The "Biden Barometer" is a measure of how stock, gold, oil, bitcoin and natural gas prices have done while President Joe Biden has been the 46th president of the United States.   Natural gas, up 175%, is the leader while Bitcoin, $BTUSD, is down 46.3%.  What a range!

Up

  • Natural Gas ($NATGAS) up 175%
  • Oil Price (WTIC) up 48.6%
Down:
  • S&P 500 ($SPX) down 2.78%
  • DJIA ($INDU) down 4.33% 
  • Wilshire 5000 Total Stock Market ($WLSH) down 8.87%
  • Gold down 11.3%
  • Nasdaq Composite ($COMPQ) down 17.65%
  • Bitcoin ($BTUSD) down 46.3%


Just for comparison, this is how the markets did under president #45, Donald Trump.

and with Bitcoin up a whopping 3,914%!


Kirk Lindstrom's Investment Letter

To see what stocks and ETFs are on my buy list and what are my price targets:
 Subscribe NOW  and get
the
 September 2022 
Issue for FREE!!!
(If you mention this ad)


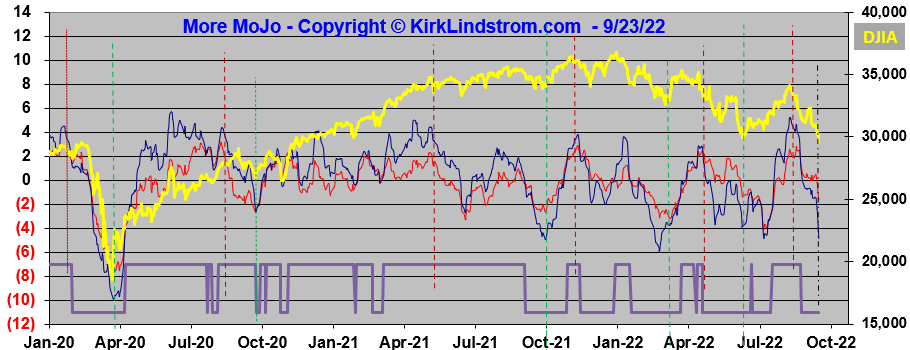
Kirk's Dow MoJo and Oscillator Charts

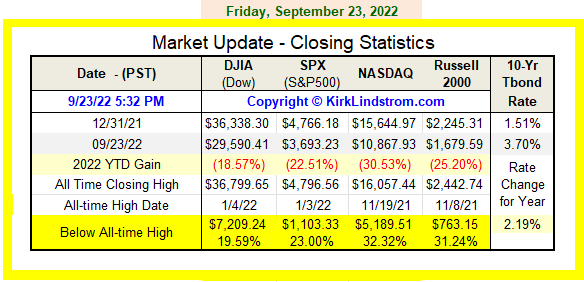
Today, September 23, 2022, the Dow Jones Industrial Average closed below its June low.  The Dow is lower today than before the COVID-19 pandemic began. 

These charts are best viewed full screen with an HD monitor.  

Kirk's Dow MoJo Chart 


Kirk's Dow vs. Oscillators Long-term Chart


Kirk's Dow vs. Oscillators Short-term Chart


Market Update


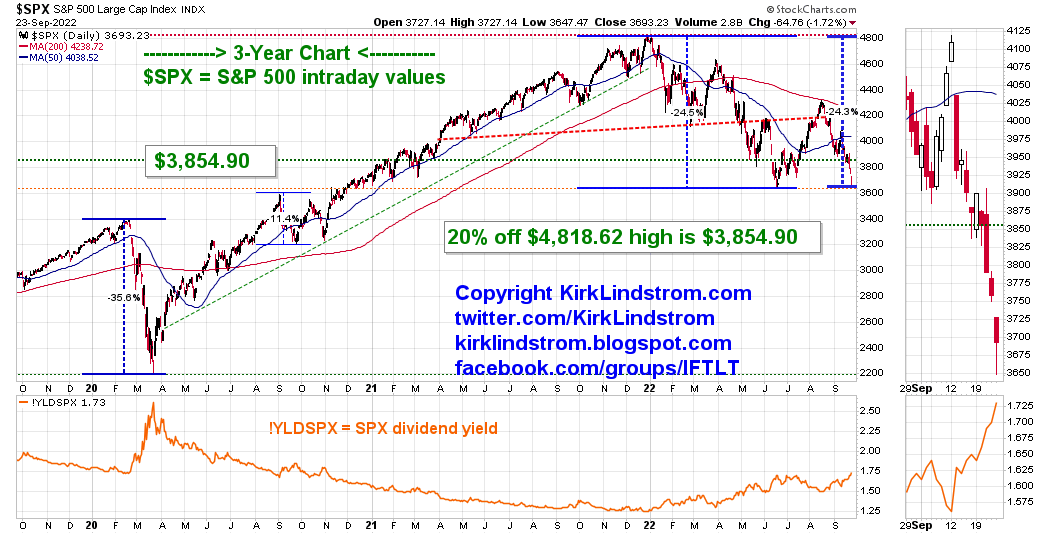
On an intraday basis, the Dow has given up all gains since it made a record high just before the pandemic began.


The S&P 500 has done a little bit better


Even though I've won many market timing awards, I'm not a big market timer... I do take profits when markets are setting records and have bought back shares near the lows of every major decline.  This helps me "ratchet up my cash" so the portfolio is less volatile, holds gains and outperforms in the long-term from both this "timing" as well as individual stock selection.

Kirk's Explore Portfolio 
Don't trust anyone who doesn't show drawdowns in their portfolios. Most people won't even show you their newsletter performance vs the S&P 500 over time for obvious reasons.

Kirk Lindstrom's Investment Letter

To see what stocks and ETFs are on my buy list and what are my price targets:
 Subscribe NOW  and get
the
 September 2022 
Issue for FREE!!!
(If you mention this ad)

More Articles by Kirk Lindstrom:
Let me know if you have issues reading these charts and I'll try to compress them in an update of this article.

Friday, September 02, 2022

Biden Barometer - Stock Market and Energy Price Performance Under President Biden

9/2/22 #BidenBarometer :  Stock Market & Oil Price Performance under President #46 Joe Biden

 $SPX $COMPQ $RUT $INDU $SPY $DIA
#BidenBarometer #BitCoin $BTCUSD


Trump Barometer:  Stock Market Performance under President #45 Donald Trump