🐂📈Kirk Lindstrom's Investor Bull/Bear Sentiment Charts for 2/23/23 📉🐻
II Investors Intelligence & AAII (American Association of Individual Investors) Sentiment Updates
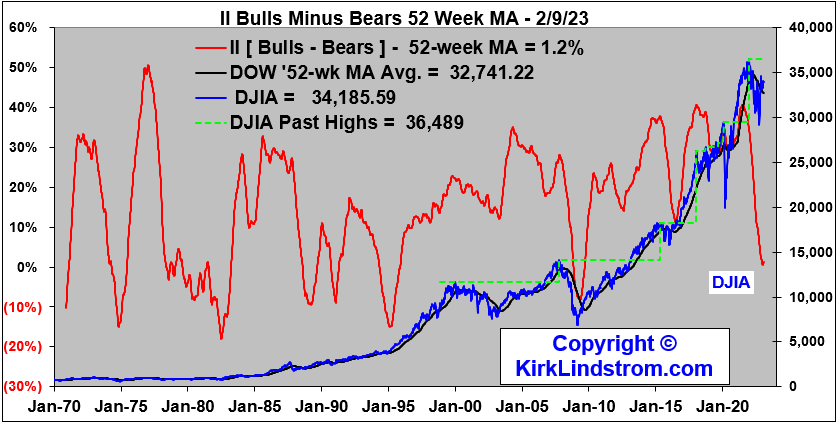
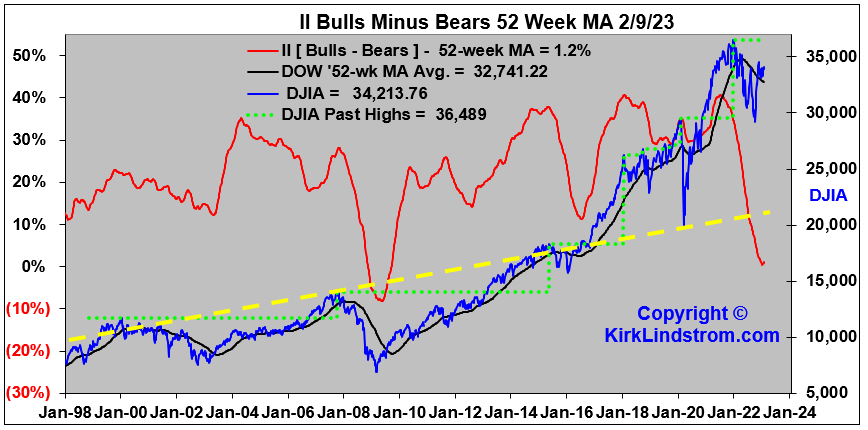
II Bulls and Bears Sentiment Graphs
- % Bulls = 44.4
- % Bears = 26.4
- % Bulls / (% Bulls +% Bears) = 62.7


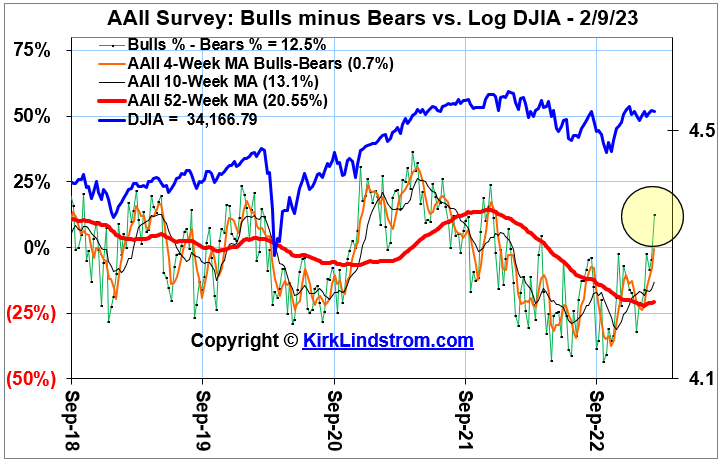
- Bullish: 21.6%
- Neutral: 38.6%
- Bearish: 39.8%
- Current Data from https://www.aaii.com/sentimentsurvey


The Global Investor Confidence Index increased to 77.5, up 1.1 points from January’s revised reading of 76.4. The increase was led by a 5.8 point rise in Asian ICI to 98.2, as well as a 4.1 point increase in European ICI to 106.4. North American ICI, meanwhile, fell 0.3 points to 72.8.
The Investor Confidence Index was developed at State Street Associates, State Street Global Markets research and advisory services business. It measures investor confidence or risk appetite quantitatively by analyzing the actual buying and selling patterns of institutional investors. The index assigns a precise meaning to changes in investor risk appetite: the greater the percentage allocation to equities, the higher risk appetite or confidence. A reading of 100 is neutral; it is the level at which investors are neither increasing nor decreasing their long-term allocations to risky assets. The index differs from survey-based measures in that it is based on the actual trades, as opposed to opinions, of institutional investors.

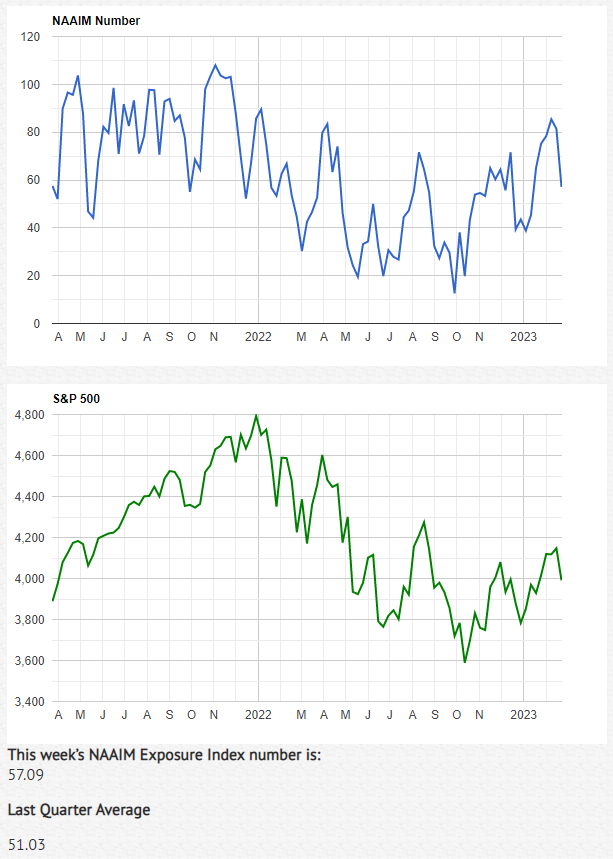


- 200% Leveraged Short
- 100% Fully Short
- 0% (100% Cash or Hedged to Market Neutral)
- 100% Fully Invested
- 200% Leveraged Long
- Source

the February 2023 Issue for FREE!!!
(If you mention this ad)
Reminder, you can subscribe to this feed for free to get sent emails by Google when I post new charts and articles. Just click "Follow" below.