This very interesting article from CNBC "Why traditional diversification is ‘downright dangerous" explains why Nobel Prize winner Burton Malkiel believes that traditional 60:40 stocks:bonds asset allocation is "downright dangerous."
Burton Malkiel is the chief investment officer at Wealthfront, a Princeton professor and author of the investment classic, "A Random Walk Down Wall Street: The Time-Tested Strategy for Successful Investing (Completely Revised and Updated) ," a book that helped launch the low-cost index-investing revolution.
Key Points:
"The investor in bonds is, I think, very likely to get badly hurt by sticking with the 60/40."
CNBC: Why did we ever get the 60/40 in the first place?
Malkiel: I don't know. And I don't like any kind of norm, because it depends on so many factors—and your personality.
The correct allocation ought to depend on individual circumstances. It is definitely not the right kind of thing for everybody. What I had in my "Random Walk" for the last several editions is a quite different allocation. You should have more equity orientation. Another rule of thumb: Jack Bogle has often said bonds should be a percentage equal to your age. I don't agree with that, either.
I think that allocation is particularly wrong today because we are in an age of financial repression. ... Europe and Japan are having trouble reining in budget deficits, and we have high debt in the U.S., too. (The governments) are deliberately keeping interest rates down. Even a U.S. bond index fund is not the right thing to do, because BND [Vanguard Total Bond Market ETF] is about two-thirds government or agency bonds.
The investor in bonds is, I think, very likely to get badly hurt by sticking with the 60/40.
CNBC: In the recent editions of "Random Walk," you suggested the following portfolio for an investor in his or her 50s—with each asset class represented by a low-cost fund—and for the percentage allocated to equities to be larger, depending on the age and risk tolerance of the investor:
How would you update that portfolio?
Malkiel: The recent editions were written when bonds had a generous yield. Today BND yields are about 2.4 percent. That is why we suggest the bond (safer) part of the portfolio be fine-tuned. We ... use high-quality dividend growth stocks for a part of what otherwise would be a straight bond portfolio. Also, we use some foreign bonds where debt/GDP is low and yields are relatively high.
The updated portfolio for an investor in his or her 50s would look like:
- Dividend growth stocks, emerging market bonds and tax-exempt bonds: 27.5 percent
You use that as a starting point and move allocations up or down, depending on your age.
Note that Malkiel doesn't like hedge funds or gold. CNBC gets a lot of free content from hedge fund managers hoping the exposure will convince some watching to look them up and ask them to manage money for a 2% annual fee plus 20% of any gains, called "2 and 20" or "2.20" by Malkiel.
CNBC: How has your view of asset allocation changed over the years?
Malkiel: I'm more open to the idea that you need stability. You may not, as an individual, just be psychologically able to stand the amount of volatility that equities have. You want a little more stability. ... I can understand that. It depends on your ability to not go crazy and sell at the wrong time when the equities drop, as they do.
I'd like to broaden the definition of how you get the stability. It's just saying ... in today's world, bonds as the only possibility to add stability to a portfolio is a much too narrow way to look at it, and a suboptimal way.
We're talking about a broader definition of diversification. There are some financial advisors using this window to broaden it to include a lot of alternative asset classes, like gold.
Some are even suggesting hedge funds. I believe in wider diversification, but for me wider diversification would be to look at some emerging markets that are very unpopular. Or REITs. Real estate is a hard asset, good when inflation is low.
Something like a hedge fund that charges 2.20 percent is a sure loser.
I'm not a big fan of gold. People say it's a hedge against Armageddon. If the world disappears, your asset allocation will be the least of your concerns.
CNBC: What are the criteria you use to judge an asset class?
Malkiel: You want to control the things you can control. Worry very much about the costs you pay. All of us who deal with the stock market need to be very modest about our ability to make money. But the one thing is certain: The lower the fee I pay ... the more there will be for other investments. Worry about taxes on an asset class, fees, and you do want to be diversified. It's a totally reasonable thing to want stability, but it is not clear to me that that means bonds—or U.S. bonds, specifically.
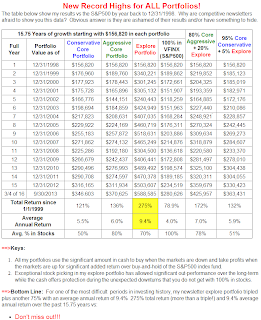
Note: My "core conservative portfolio" is probably too conservative according to Malkiel with 50% in "fixed income" with none of it currently in bonds and 50% in equities and REITs. My "aggressive core portfolio" with 20% "fixed income" (none of which are bonds) and "80%" in equity index funds plus a REIT and 20% of the total portfolio in an "explore portfolio" with some bonds fits his model quite well.
This table shows my newsletter "Core and Explore Portfolios" from 1998 through the end of Q3
Don't Miss Out!
Subscribe Now
and get the November issue for free
(Start subscription with December issue)


