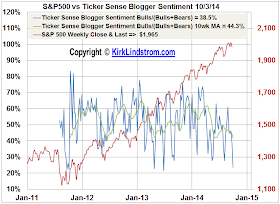
Notice on this chart how the S&P500 rebounded sharply after touching the dotted blue support line on my two graphs below.
S&P500 Charts with Resistance and Support
After taking profits in my positions when the market was hitting record highs, I started adding to my shares again this week with a new buy alert sent to my subscribers on Monday when this Ticker Sense chart indicated a possible low was close.
Ticker Sense sentiment is measured weekly and reported on Mondays so it often turns up AFTER a short-term bottom is made.
What do you think?
Will the market rally to a new high somewhere below the dashed red resistance lines on my top two graphs then make a bigger correction to the 200 day moving average?
New Feature for my Monthly Newsletter:
- You DO NOT NEED TO READ the complete newsletter each month. Starting with the November issue, I will write the new content in black with the content repeated from the past month in blue so you can quickly skip ahead to what is new each month.


No comments:
Post a Comment