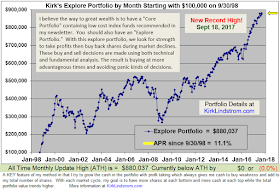
Here are some very interesting charts:
This chart of the Dow is best viewed on a large screen in "Full Screen Mode"
Note the break-out of the Dow above the top dashed blue line followed by a correction to test the breakout from above. This aligned with many of my sentiment indicators where I also sent out buy alerts for several stocks for my Explore Portfolio.
Emerging Markets have been on fire, especially since loading up while in the circled yellow region!
Biotech (IBB) is up about 50% from its 2016 bottom. With plenty of room to the upside for the sector, I have great hope for my Explore Portfolio positions in two small biotech companies that I added to during the period of weakness. I have some very nice gains already, but would love to see more!
Kirk Lindstrom's Investment Letter
Subscribe NOW and get the September 2017 Issue for FREE!!!
(Your 1 year, 12 issue subscription with SPECIAL ALERT emails will start with November issue.)


No comments:
Post a Comment