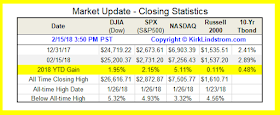
This market update chart shows the Dow, S&P 500, Nasdaq and Russell 2000 small cap index are now all back in the green for the year.
Click "Follow" at the bottom of this blog to get FREE email notifications from Google's Blogger when I post new updates.
This chart shows the depth of the correction for the major averages. How many who said they would buy after a 10% correction showed up? It looks like some sure did!
This chart shows the S&P 500 has rallied to its 50-day moving average, MA(50), after correcting down to its MA(200).
This chart shows the Dow corrected down to the dotted orange trend line before bouncing.
These sentiment charts show that even after a big recovery, there is still plenty of fear remaining.
Can you guess when I will draw the next green dot?
Fear and Greed index starting to recover.This inverted head & shoulder plot is very exciting.
Did you buy anything during the market decline?
I did. Here is part of one of my special email alerts I sent my subscribers:
I did. Here is part of one of my special email alerts I sent my subscribers:
To get my "Special Email Alerts" and the "Auto Buy Sell Table" where I list ahead of time what stocks to buy at what prices during this decline,
Kirk Lindstrom's Investment Letter
(My SPECIAL ALERT emails will begin as soon as I get payment via check or PayPal)


No comments:
Post a Comment