Market Data for 9/11/19
 |
| Market Update - Closing Statistics |
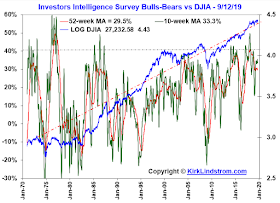
The "pros" in the II graph are more bullish than individual investors in the AAII graph with the number of bullish individual investors back above the number of bullish investors.
II Bulls-Bears Sentiment Graph - Log Scale
AAII Survey: Bulls minus Bears vs. Log DJIA
Kirk Lindstrom's Investment Letter
Don't miss out!
Subscribe NOW
and get the September 2019 Issue For Free!
and get the September 2019 Issue For Free!
TD: Timer Digest ST (1-yr) Bulls - Bears vs. S&P 500
TD: Timer Digest Gold Bulls - Bears vs. GLD
Put Call Ratio ($CPC)
TD Timer of the Year Race
(I'm tied for second for 2019!)
(I'm tied for second for 2019!)
Kirk Lindstrom's Investment Letter
Don't miss out!
Subscribe NOW
and get the September 2019 Issue For Free!
and get the September 2019 Issue For Free!
Never Forget 9/11/01


No comments:
Post a Comment