🐂📈Kirk Lindstrom's Investor Bull/Bear Sentiment Charts for 10/27/22 📉🐻
Reminder, you can subscribe or follow this feed and get sent emails by Google when I post new charts and articles.
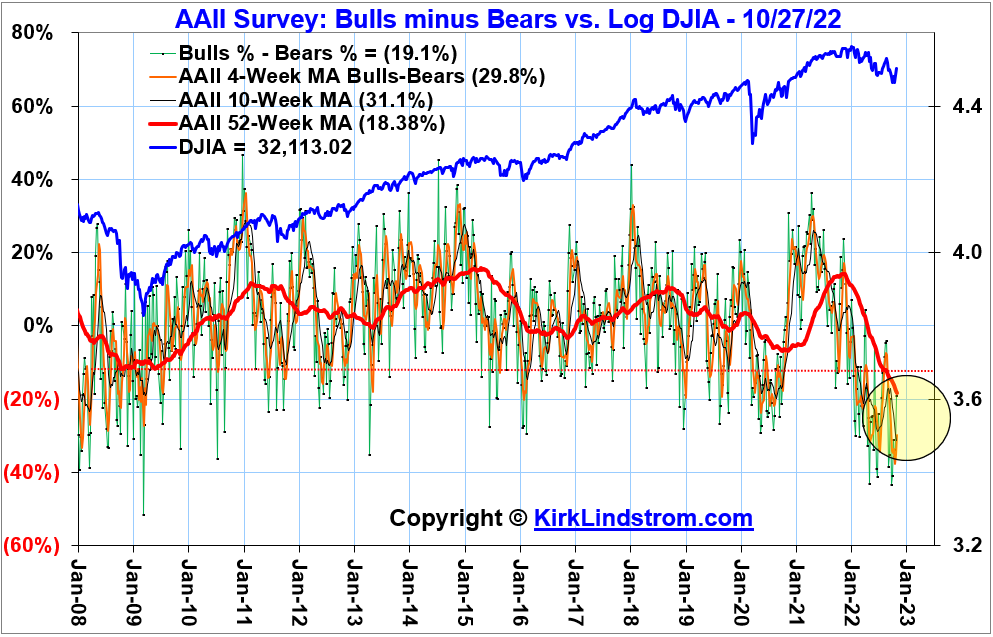
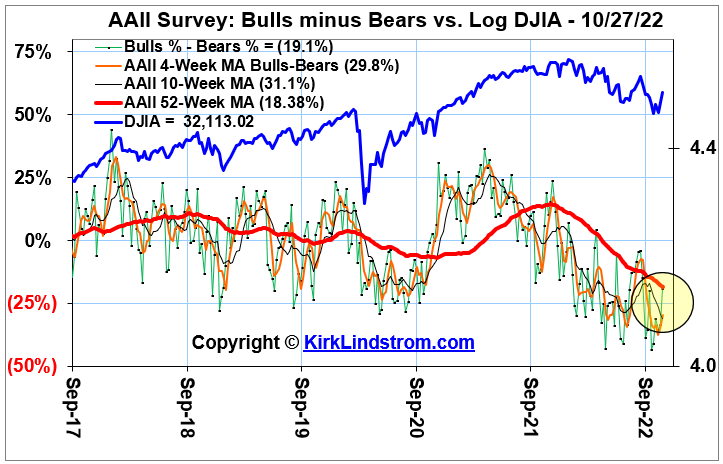
Graph of the American Association of Individual Investors (AAII) Bulls Minus Bears Sentiment Indicator vs the Dow.
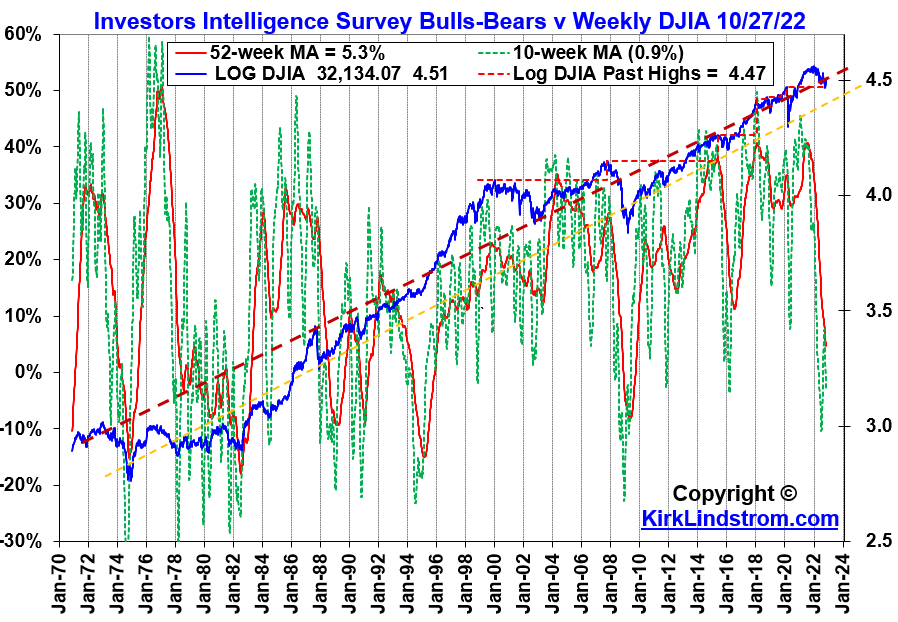
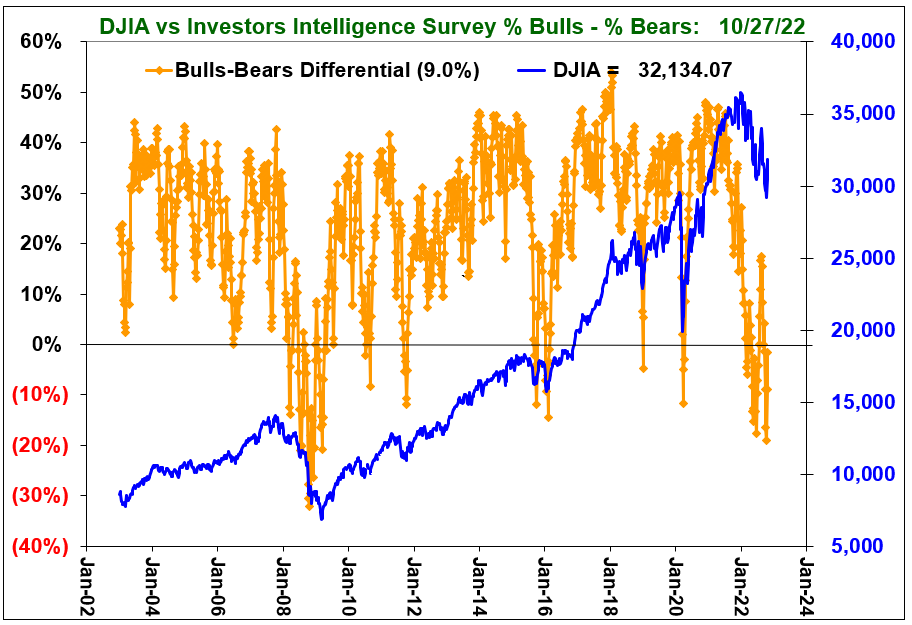
Graph of the II, Investors Intelligence, Bulls and Bears Survey vs Log Dow Graphs
CNN's Fear & Greed Index
CPC Put Call Ratio
Kirk Lindstrom's Investment Letter
To see what stocks and ETFs are on my buy list and what are my price targets:
Subscribe NOW and get
the October 2022 Issue for FREE!!!
(If you mention this ad)
the October 2022 Issue for FREE!!!
(If you mention this ad)
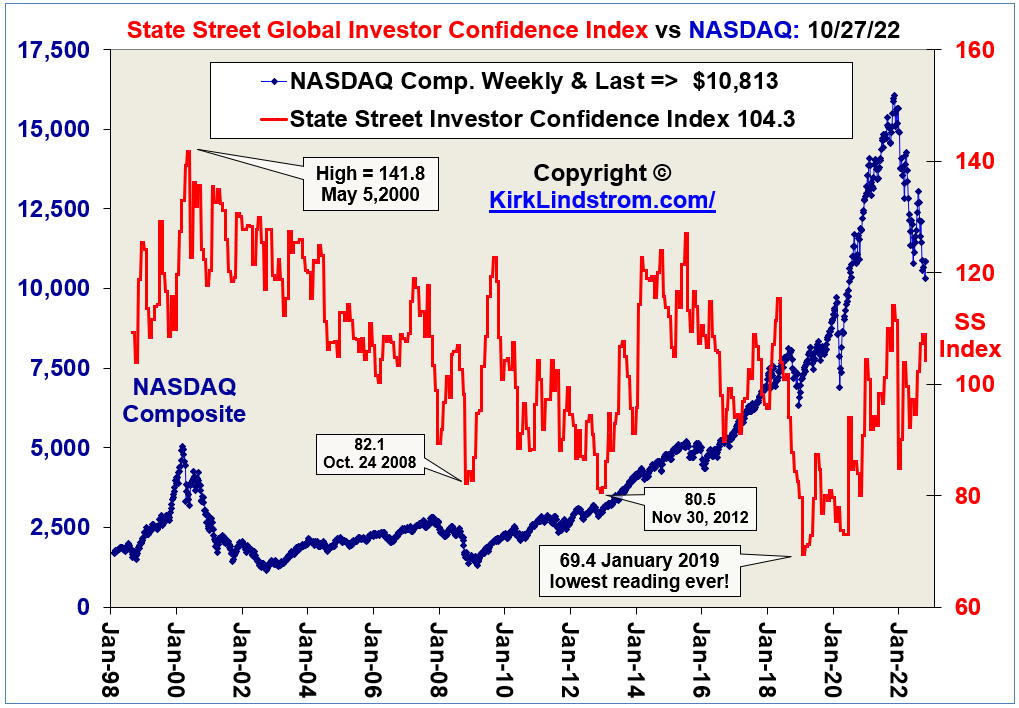
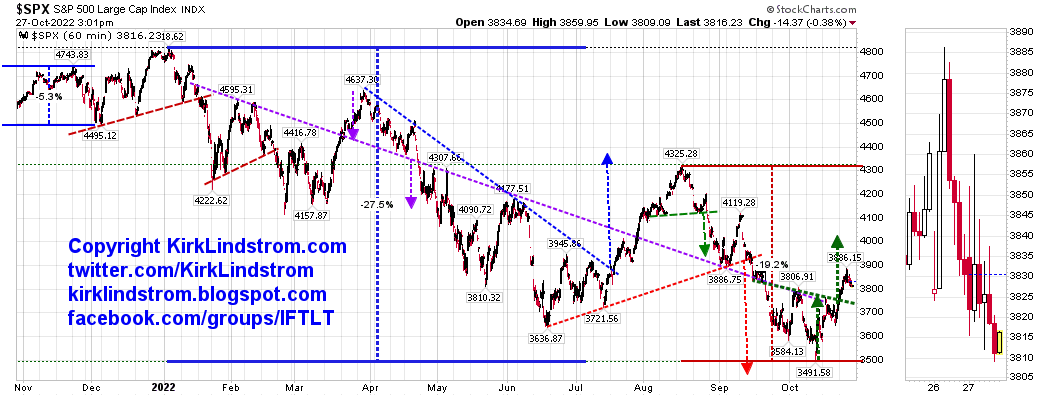
🐻📉Kirk Lindstrom's Bull and Bear Sentiment Charts🐂📈
Next Article:






No comments:
Post a Comment