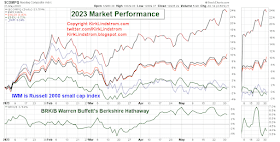
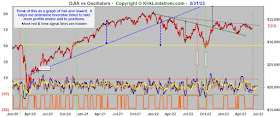
Five of twelve months into 2023, we have a split market with the Dow and the Russell 2000 indexes down while the S&P 500 and the Nasdaq indexes are up. All four remain down double digits from their ATHs (All Time Highs) also summarized in the same table.
S&P 500 Stocks YTD Heat Map where the size of the boxes represents the market capitalization (share price times shares outstanding) . Meta, AKA Facebook, more than doubled during the first five months of 2023.
These wide images are best views in full screen
My Results YTD are Impressive if I may say so myself... I'm roughly matching SPY YTD with only 57% in the markets! My Explore Portfolio stocks on their own are up roughly 15.8% YTD! Over the long term, I've smashed the index which very, very few have done.
To see what stocks and ETFs are in my "Explore Portfolio" and get a full list of on my price targets to both take profits or buy more:
Subscribe NOW and get
the May 2023 Issue for FREE!!!
(If you mention this ad)
the May 2023 Issue for FREE!!!
(If you mention this ad)
x


No comments:
Post a Comment