Wednesday, June 12, 2024

Treasury Revenue Soars Again, but Deficit Grows by Another $347 Billion

Kirk's 6/12/24 Deficit Spending Update: For FY 2024 to date, total taxes and other revenues collected YTD are up 9.8% year-over-year.  The "good news" is SPENDING grew at "only" 8.0%!  This means the deficit is growing a "slower rate." 

The problem is during periods of economic growth like we've had for several years, we should be paying down debt by keeping spending below revenue, but we're doing the opposite.


After rising 10.3% in April 2024 vs April 2023, US Treasury revenue grew another 9.8% in May 2024 compared with May 2023.  The trouble is spending grew at 8.0% and remains well above revenue.  

Summary


Stated as a household budget by dividing by 40,000,000:


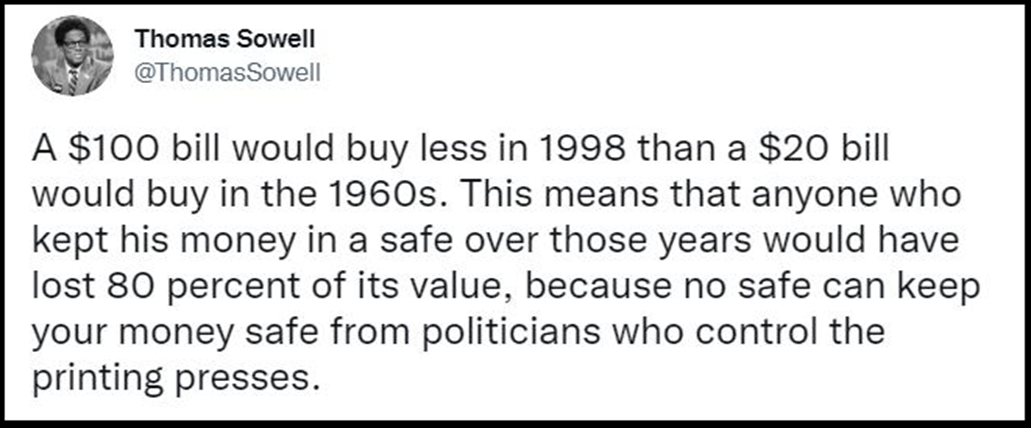
Inflation is a lazy government's way to raise taxes by pushing us into higher tax brackets while the spenders use borrowed money to buy vote for reelection without regard for what is good for the country.  Understanding this data is KEY but few take the time to bother.


Kirk Lindstrom's Investment LetterTo see what stocks and ETFs are in my "Explore Portfolio" and get a full list of on my price targets to both take profits or buy more: 

Subscribe NOW  and get
the
 June 2023 
Issue for FREE!!


DATA FROM: https://www.fiscal.treasury.gov/files/reports-statements/mts/mts0524.pdf
x

May CPI at 3.3% Is Still Above Fed's 2.0% Target

 Despite President Biden's "Inflation Reduction Act of 2022" (estimated to contain $500B in new spending and tax credits) and the Federal Reserve keeping its Fed Funds Interest Rate at a 20-year high, inflation at 3.3% is 1.3% or 65% above the desired or "target rate" of 2.0%.

CPI-U: This morning the US Bureau of Labor Statistics announced, "The Consumer Price Index for All Urban Consumers (CPI-U) was flat in May on a seasonally adjusted basis, after rising 0.4 percent in April". and "Over the last 12 months, the all-items index increased 3.3 percent before seasonal adjustment."

Core CPI-U: "The index for all items less food and energy rose 0.2 percent in May, after rising 0.3 percent the preceding month" and "The all items less food and energy index rose 3.4 percent over the last 12 months."

Chart: CPI vs Fed Funds Rate vs Expected 10-Yr Inflation from 2004


Chart: CPI vs Fed Funds Rate vs Expected 10-Yr Inflation from 2020


Table: Raw Inflation Data from November 2023:


Kirk Lindstrom's Investment LetterTo see what stocks and ETFs are in my "Explore Portfolio" and get a full list of on my price targets to both take profits or buy more:

Subscribe NOW  and get
the
 June 2023 
Issue for FREE!!


Tuesday, June 11, 2024

In-N-Out Burger Prices

Today the Channel 2 Fox News in SF/Oakland CA showed the prices for In-N-Out Burger after California raised the minimum wage to $20 per hour for workers at fast food restaurants.

Here are the prices for a:

  • Double-Double $6.05
  • Cheeseburger $4.25
  • Hamburger $3.75
  • French Fries $2.40

Next, they showed the prices for an "In-N-Out Double Double Meal" by city which includes a soda.

  • San Francisco: $13.60
  • Alameda: $11.96
  • San Jose: $11.81
  • Pittsburg: $11.42

Healthy (ahem) hint: Skip the soda and drink a free water to keep your price under $10.


Discuss the prices on my FB Investing for the Long-Term Group

McDonald's Prices according to CNBC