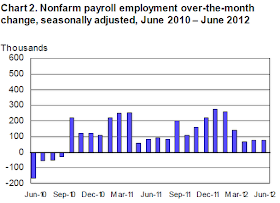
Today the Bureau of Labor Statistics of the U.S. Department of Labor released the June 2012 Jobs report. 80,000 new jobs were created in June while the unemployment rate remained the same at 8.2%. Highlights then the full press release follow:
- Nonfarm payroll employment continued to edge up in June (+80,000), and the unemployment rate was unchanged at 8.2 percent, the U.S. Bureau of Labor Statistics reported today.
- Among the major worker groups, the unemployment rate for blacks (14.4
percent) edged up over the month, while the rates for adult men (7.8
percent), adult women (7.4 percent), teenagers (23.7 percent), whites
(7.4 percent), and Hispanics (11.0 percent) showed little or no change.
The jobless rate for Asians was 6.3 percent in June (not seasonally
adjusted), little changed from a year earlier.
- The change in total nonfarm payroll employment for April was revised from +77,000 to +68,000, and the change for May was revised from +69,000 to +77,000.
Full Report:
THE EMPLOYMENT SITUATION -- JUNE 2012
Nonfarm payroll employment continued to edge up in June (+80,000), and the unemployment rate was unchanged at 8.2 percent, the U.S. Bureau of Labor Statistics reported today. Professional and business services added jobs, and employment in other major industries changed little over the month.
Household Survey Data
The number of unemployed persons (12.7 million) was essentially unchanged in June, and the unemployment rate held at 8.2 percent. (See table A-1.)
Among the major worker groups, the unemployment rate for blacks (14.4 percent) edged up over the month, while the rates for adult men (7.8 percent), adult women (7.4 percent), teenagers (23.7 percent), whites (7.4 percent), and Hispanics (11.0 percent) showed little or no change. The jobless rate for Asians was 6.3 percent in June (not seasonally adjusted), little changed from a year earlier. (See tables A-1, A-2, and A-3.)
In June, the number of long-term unemployed (those jobless for 27 weeks and over) was essentially unchanged at 5.4 million. These individuals accounted for 41.9 percent of the unemployed. (See table A-12.)
Both the civilian labor force participation rate and the employment- population ratio were unchanged in June at 63.8 and 58.6 percent, respectively. (See table A-1.)
The number of persons employed part time for economic reasons (sometimes referred to as involuntary part-time workers) was essentially unchanged at 8.2 million. These individuals were working part time because their hours had been cut back or because they were unable to find a full-time job. (See table A-8.)
In June, 2.5 million persons were marginally attached to the labor force, down from 2.7 million a year earlier. (These data are not seasonally adjusted.) These individuals were not in the labor force, wanted and were available for work, and had looked for a job sometime in the prior 12 months. They were not counted as unemployed because they had not searched for work in the 4 weeks preceding the survey. (See table A-16.)
Among the marginally attached, there were 821,000 discouraged workers in June, a decline of 161,000 from a year earlier. (These data are not seasonally adjusted.) Discouraged workers are persons not currently looking for work because they believe no jobs are available for them. The remaining 1.7 million persons marginally attached to the labor force in June had not searched for work in the 4 weeks preceding the survey for reasons such as school attendance or family responsibilities. (See table A-16.)
Establishment Survey Data
Total nonfarm payroll employment continued to edge up in June (+80,000). In the second quarter, employment growth averaged 75,000 per month, compared with an average monthly gain of 226,000 for the first quarter of the year. Slower job growth in the second quarter occurred in most major industries. (See table B-1.)
Professional and business services added 47,000 jobs in June, with temporary help services accounting for 25,000 of the increase. Employment also rose in management and technical consulting services (+9,000) and in computer systems design and related services (+7,000). Employment in professional and business services has grown by 1.5 million since its most recent low point in September 2009.
Employment in manufacturing continued to edge up in June (+11,000). Growth in the second quarter averaged 10,000 per month, compared with an average of 41,000 per month during the first quarter. In June, employment increased in motor vehicles and parts (+7,000) and in fabricated metal products (+5,000).
Employment continued to trend up in health care (+13,000) and wholesale trade (+9,000) in June.
Employment in other major industries, including mining and logging, construction, retail trade, transportation and warehousing, financial activities, leisure and hospitality, and government, showed little or no change.
The average workweek for all employees on private nonfarm payrolls edged up by 0.1 hour to 34.5 hours in June. The manufacturing workweek edged up by 0.1 hour to 40.7 hours, and factory overtime was 3.3 hours for the fifth consecutive month. The average workweek for production and nonsupervisory employees on private nonfarm payrolls edged up by 0.1 hour to 33.8 hours. (See tables B-2 and B-7.)
In June, average hourly earnings for all employees on private nonfarm payrolls increased by 6 cents to $23.50. Over the year, average hourly earnings have increased by 2.0 percent. In June, average hourly earnings of private-sector production and nonsupervisory employees increased by 5 cents to $19.74. (See tables B-3 and B-8.)
The change in total nonfarm payroll employment for April was revised from +77,000 to +68,000, and the change for May was revised from +69,000 to +77,000.
____________ The Employment Situation for July is scheduled to be released on Friday, August 3, 2012, at 8:30 a.m. (EDT).


