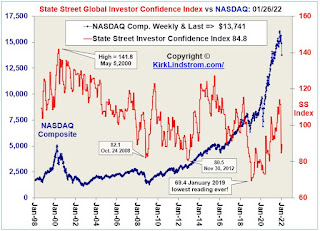
Graph of State Street Investor Confidence Index vs the S&P 500, Nasdaq & Dow
 |
| Graph of State Street Investor Confidence Index vs the S&P 500 |
 |
State Street Global Investor Confidence Index vs DJIA |
 |
| Graph of State Street Investor Confidence Index vs the Nasdaq $COMPQ |
The State Street Investor Confidence Index® (the index) provides an objective, quantitative measure of global risk tolerance of the world’s sophisticated investors. Regional components measure separately the risk appetites of institutional investors in North America, Europe and the Asia-Pacific region.The Index is released at 10 a.m Eastern Time in the US, on the last Wednesday of each month.The Premise
Confidence in the economy and the capital markets is a critical driver of economic and financial fluctuations and of the business cycle. When confidence increases, consumers and investors want to buy consumer goods, durables and invest at prevailing prices. When confidence decreases, spending and risk-taking tend to fall.
Investors are said to be confident when the news about the future is good and stock prices are rising. However, rising prices are related both to good fundamentals, such as growth in industrial production and productivity, as well as to the underlying sentiment or mood of investors. A good confidence measure should indicate whether, for a given set of fundamentals, investors have an increased or decreased appetite for risk.
Quantitatively measuring shifts in investor sentiment presents a unique set of problems to researchers. Investor surveys are often outdated by the time they are released. On the institutional side, accuracy can be compromised as decision makers are often too busy to fill out surveys. In all cases, survey responses, like prices, tend to obscure the effects of fundamentals and investor sentiment.
More about Kirk Lindstrom's Investment Letter Service:
- Subscribe NOW and get the January 2022 Issue for FREE!!!


No comments:
Post a Comment