Don't Miss Out On Great Gains! - Best Investment Newsletter


Click for FREE sample of Kirk Lindstrom's Investment Letter

Don't miss out! Subscribe Now

google.com, pub-7001134751860982, DIRECT, f08c47fec0942fa0

Search For More

Thursday, May 23, 2024

Kirk's Investor Sentiment & Other Charts

Market Sentiment Update 

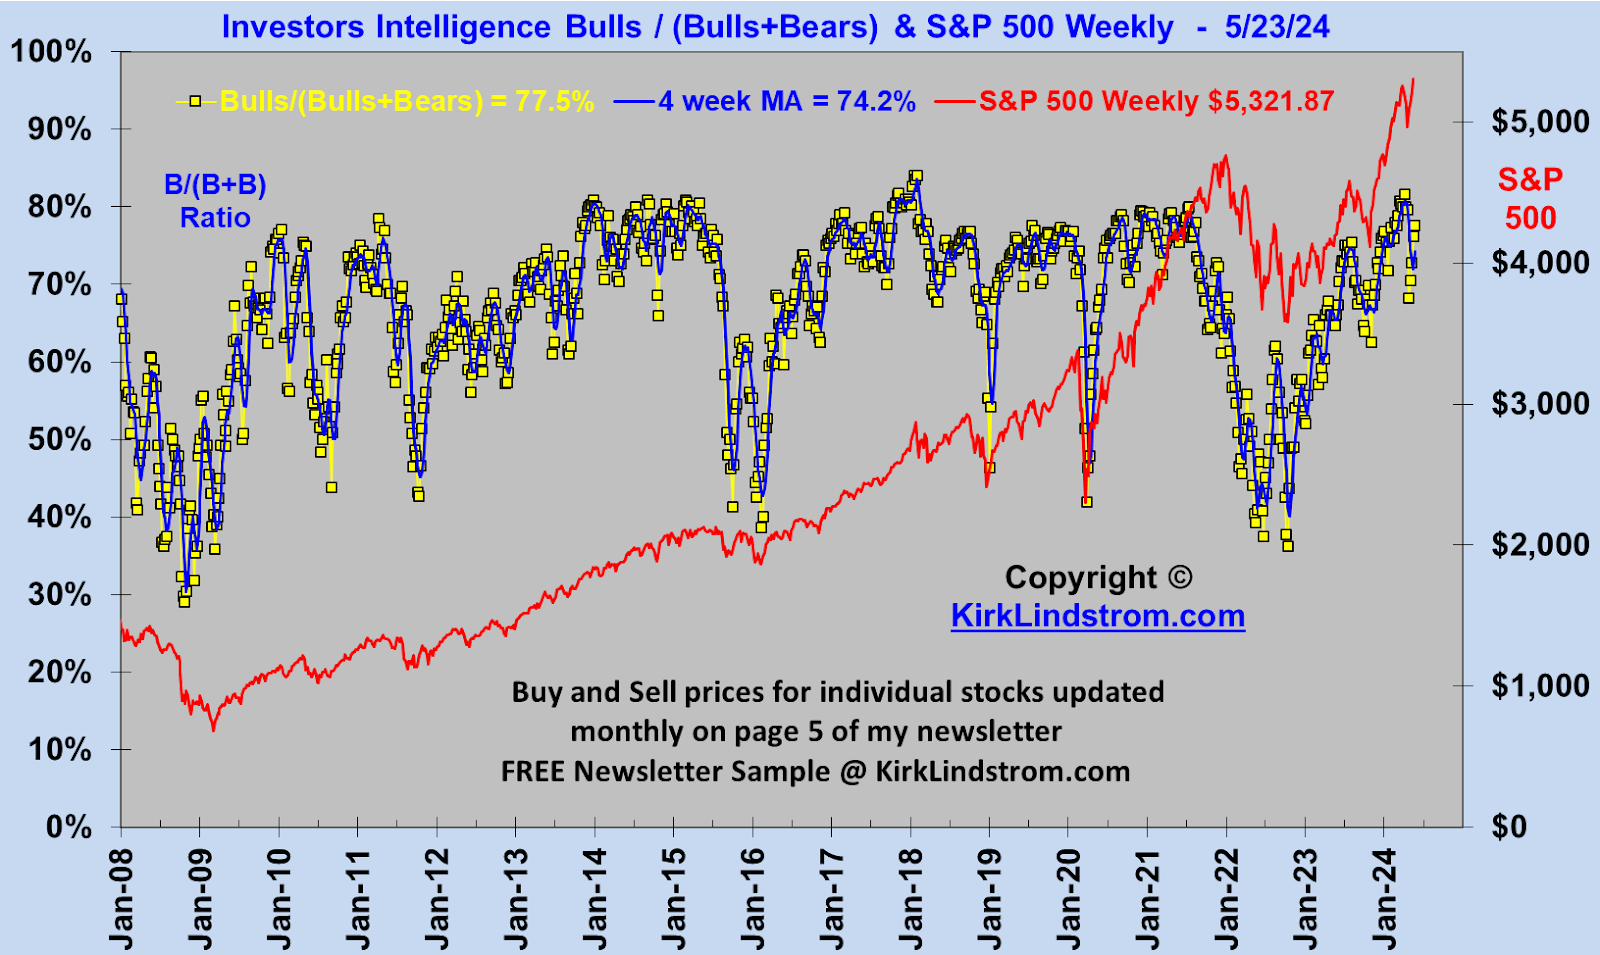
Investors Intelligence Bulls / (Bulls+Bears) & S&P 500 Weekly  -  5/23/24


AAII Survey: Bulls minus Bears vs. Log DJIA - 1988 to Today


US Stock Markets (Log Scale) vs. Fed Funds Rate 


10-Yr & 30-Yr T-Bond Rates vs S&P 500


CPC Put Call Ratio 


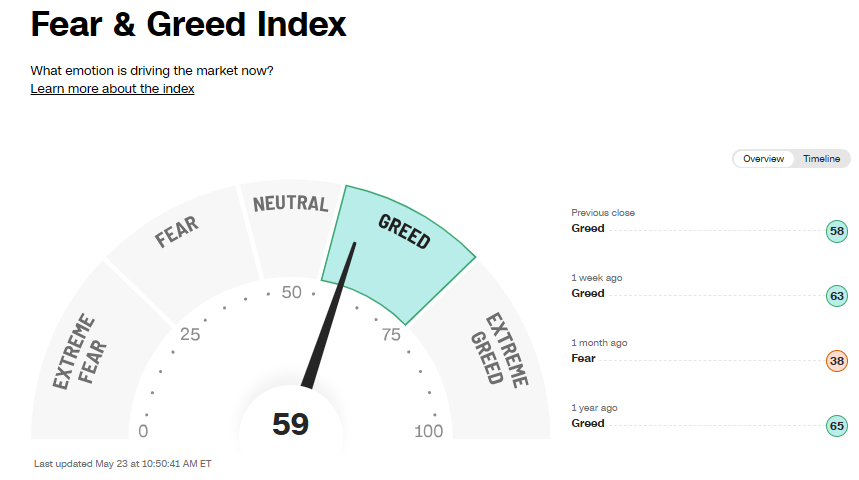
Fear and Greed Index @ 59
From https://www.cnn.com/markets/fear-and-greed


NAAIM EXPOSURE INDEX = 89.25: 
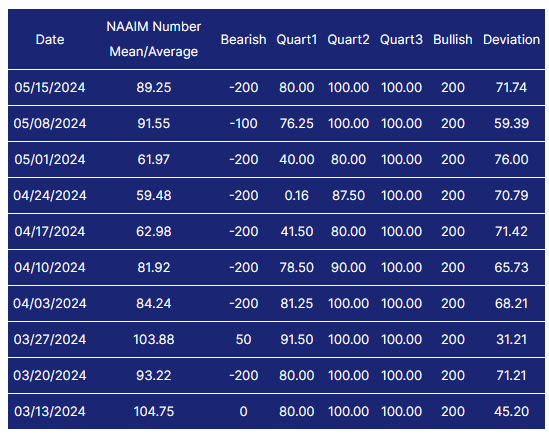
  • The NAAIM Exposure Index represents the average exposure to US Equity markets reported by our members.
  • https://naaim.org/programs/naaim-exposure-index/


2CS-p = 90.3 VERY high:  
Invented by Tom Drake, the 2CS-p is the "5 day moving average of the product of the vix and p/c ratio."   The scale runs from 0 to 100% with 0% max bullishness and 100% max bearish reading for us contrarians.


For more on investor sentiment and what it means to me, read my newsletter where 
  • Page 6 is dedicated to a monthly update on sentiment.
  • Page 12 summarizes sentiment and how it relates to five other "Market Factors" I follow.

Subscribe NOW  and get
the
 May 2023 
Issue for FREE!!


Kirk Lindstrom's Investment LetterTo see what stocks and ETFs are in my "Explore Portfolio" and get a full list of on my price targets to both take profits or buy more

Excerpt from my May 2024 Newsletter:

This is not an “exact science” so “all or nothing” market timing is foolish.

Market Timing Disclaimer: No sentiment indicator, or any indicator for that matter, is 100% reliable. I look at sentiment as head winds and tail winds. When sentiment is terrible, then it acts like a tail wind for your returns where you could see further declines, but long term, it is best to be buying when most others are selling. Likewise, if we see sentiment get too bullish, then I would consider lowering my portfolio asset allocation. It seldom pays to be buying stocks when EVERYONE is talking about stocks and how much money they are making at cocktail parties.

In addition, I am not market timing but for a small portion of my Explore Portfolio. I use market-timing indicators to tell me it is a good time to buy so I can add to positions when the market is down and thus help me overcome my fear to rebalance back to my target asset allocation. Likewise, when the market-timing indicators are saying to sell, they usually come when the markets are high where I want to be taking profits. The market timing indicators at market highs help me get over my greed and take profits.


Wednesday, May 15, 2024

April CPI Still Hot at 3.4% vs Fed's 2.0% Target

Despite President Biden's "Inflation Reduction Act of 2022" (estimated to contain $500B in new spending and tax credits) and the Federal Reserve keeping its Fed Funds Interest Rate at a 20-year high, inflation at 3.4% is 1.4% or 70% above the desired or "target rate" of 2.0%.

CPI-U: This morning the US Bureau of Labor Statistics announced, "The Consumer Price Index for All Urban Consumers (CPI-U) increased 0.3 percent in April on a seasonally adjusted basis, after rising 0.4 percent in March". and "Over the last 12 months, the all items index increased 3.4 percent before seasonal adjustment."

Core CPI-U: "The index for all items less food and energy rose 0.3 percent in April, after rising 0.4 percent in each of the 3 preceding months." and "The all items less food and energy index rose 3.6 percent over the last 12 months."

Chart: CPI vs Fed Funds Rate vs Expected 10-Yr Inflation from 2004


Chart: CPI vs Fed Funds Rate vs Expected 10-Yr Inflation from 2020


Table: Raw Inflation Data from October 2023


Chart: Fed Funds Interest Rate vs S&P 500 - 1993 through today

Chart: Fed Funds Interest Rate vs S&P 500 - 2019 through today


Tariffs and Inflation:  Perhaps I should have included President Trump's tariffs as a contributor to inflation stubbornly remaining above the desired 2.0% target.


If so, then President Biden's new tariffs will make inflation worse.

Yesterday President Biden announced new tariffs on goods manufactured in China. 
WASHINGTON, May 14 (Reuters) - President Joe Biden is hiking tariffs on $18 billion in Chinese goods including electric vehicles, batteries, semiconductors, steel, aluminum, critical minerals, solar cells, ship-to-shore cranes, and medical products, while retaining Trump-era tariffs on over $300 billion in goods. 
The United States Trade Representative's Office told Reuters it anticipates the effective date will be in approximately 90 days.


Spending $500B to "reduce inflation" and then implementing new tariffs then listening to others debate the merits...

Kirk Lindstrom's Investment LetterTo see what stocks and ETFs are in my "Explore Portfolio" and get a full list of on my price targets to both take profits or buy more:

Subscribe NOW  and get
the
 May 2023 
Issue for FREE!!


Discuss this article at my Investing for the Long Term Facebook group.

Followers - Click "follow" to get an email alert for new articles

Kirk Lindstrom's Investment Letter Performance