Don't Miss Out On Great Gains! - Best Investment Newsletter


Click for FREE sample of Kirk Lindstrom's Investment Letter

Don't miss out! Subscribe Now

google.com, pub-7001134751860982, DIRECT, f08c47fec0942fa0

Search For More

Showing posts with label AAII. Show all posts

Thursday, February 27, 2025

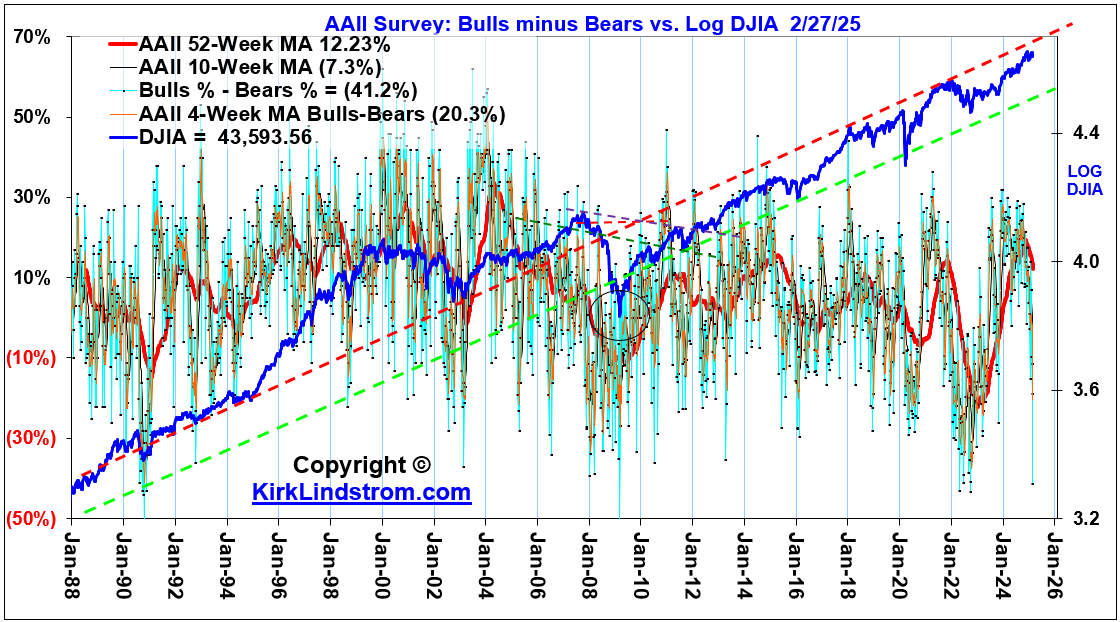
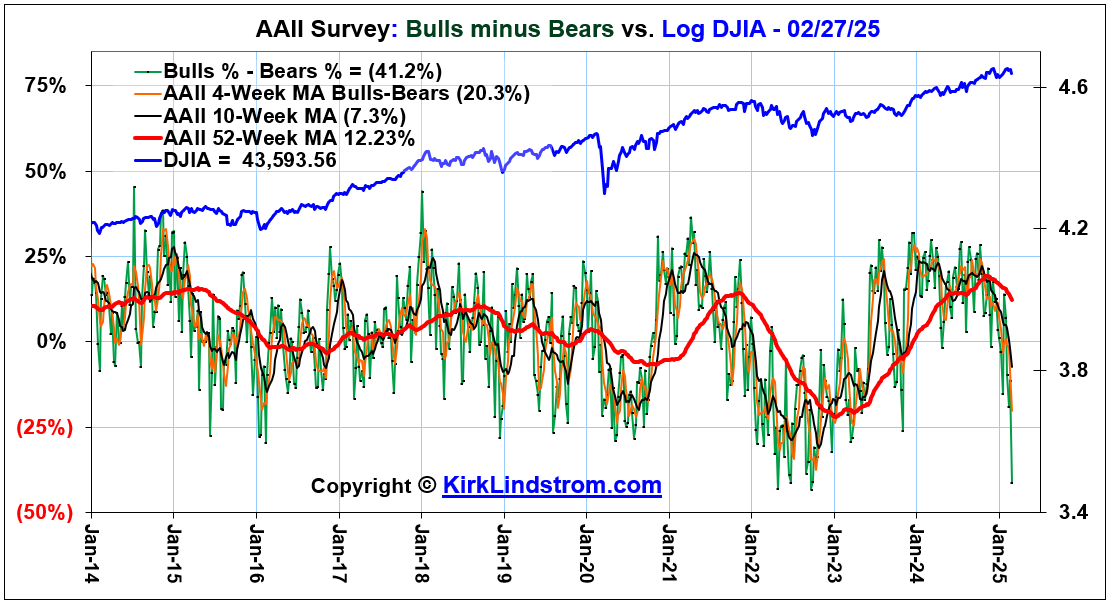
AAII Survey: Sentiment Crashes to Near 37-year Lows

 AAII Survey: Bulls minus Bears vs. Log DJIA - 1988 to Today


Kirk Lindstrom's Investment Letter

To see what stocks and ETFs are in my "Explore Portfolio" and get a full list of on my price targets to both take profits or buy more:
 Subscribe NOW and get
the February 2025 Issue for FREE!!
(If you mention this ad)


2/27/28 Update 12:29 PM PST 

Fear and Greed Index at 20


Thursday, August 08, 2024

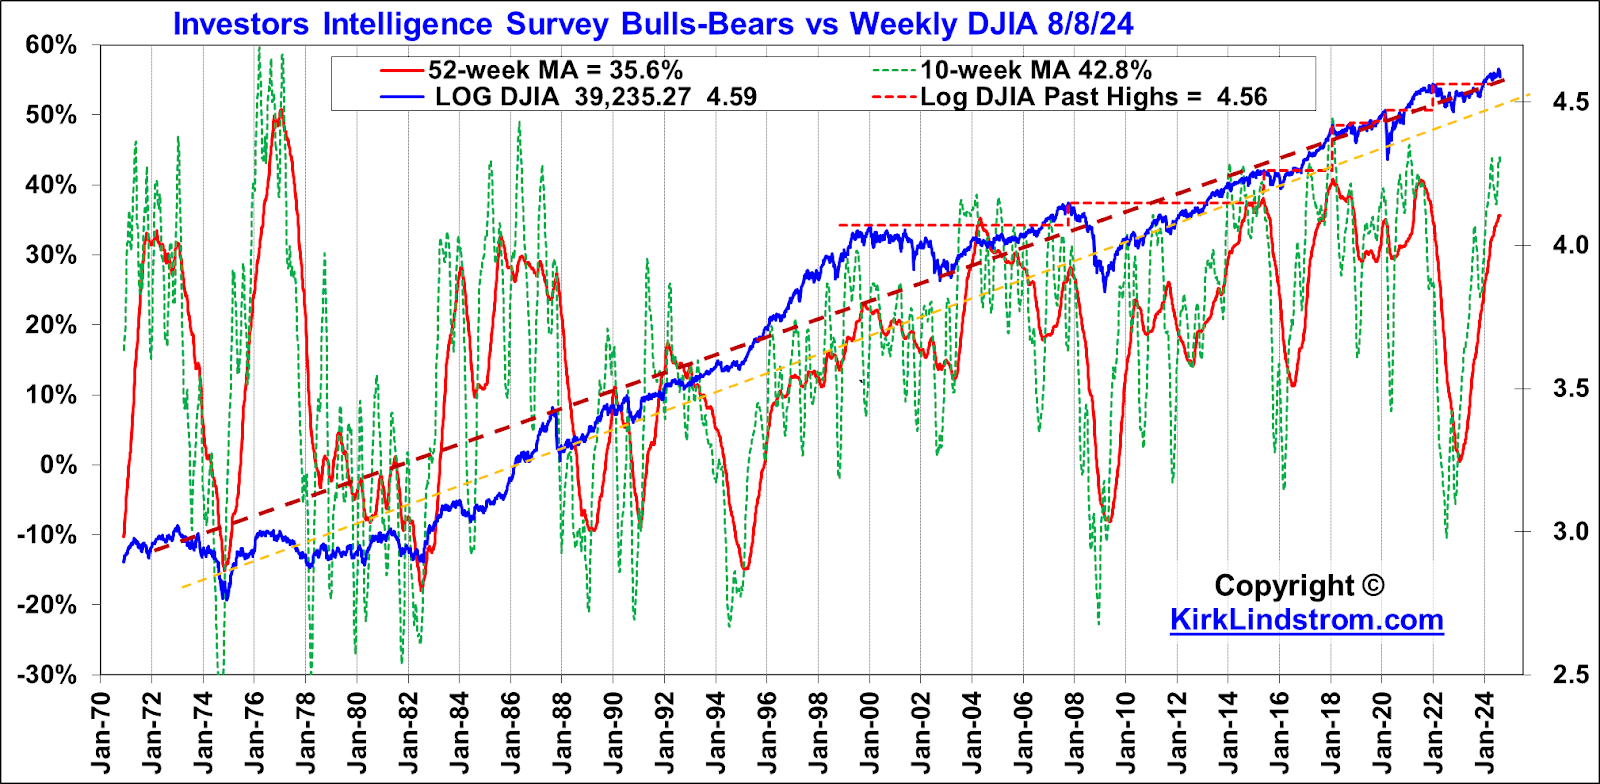
Kirk's Latest Investor Sentiment & Other Charts

Market Sentiment Update 

Read  Kirk Lindstrom's Investment Letter to see what these charts meant to me plus the full list of stocks and ETFs are in my "Explore Portfolio" with my price targets to both take profits or buy more shares, depending on market conditions, prices, sentiment and other factors.

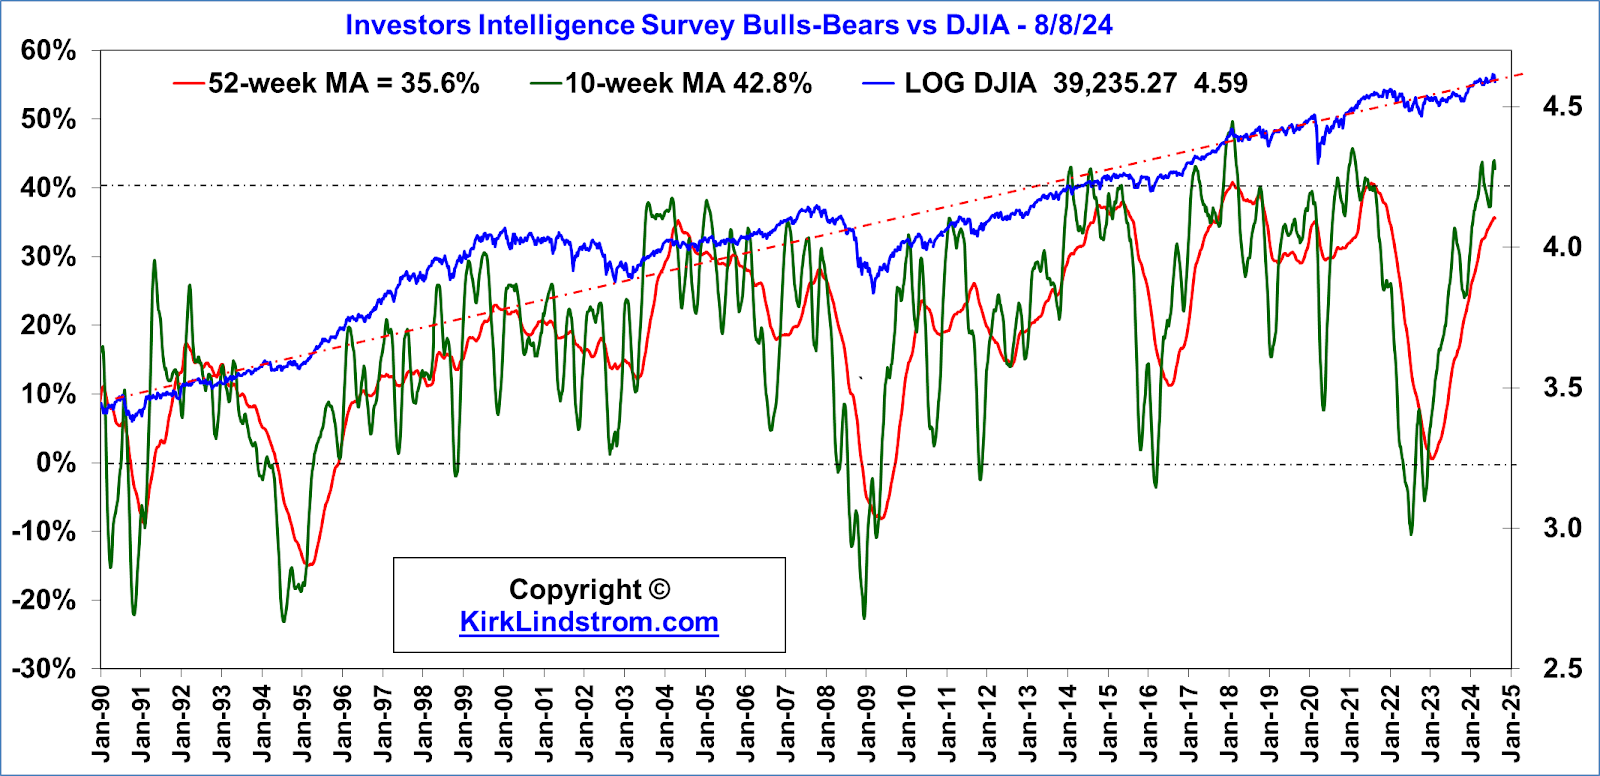
Investors Intelligence Bulls / (Bulls+Bears) & S&P 500 Weekly  -  8/8/24


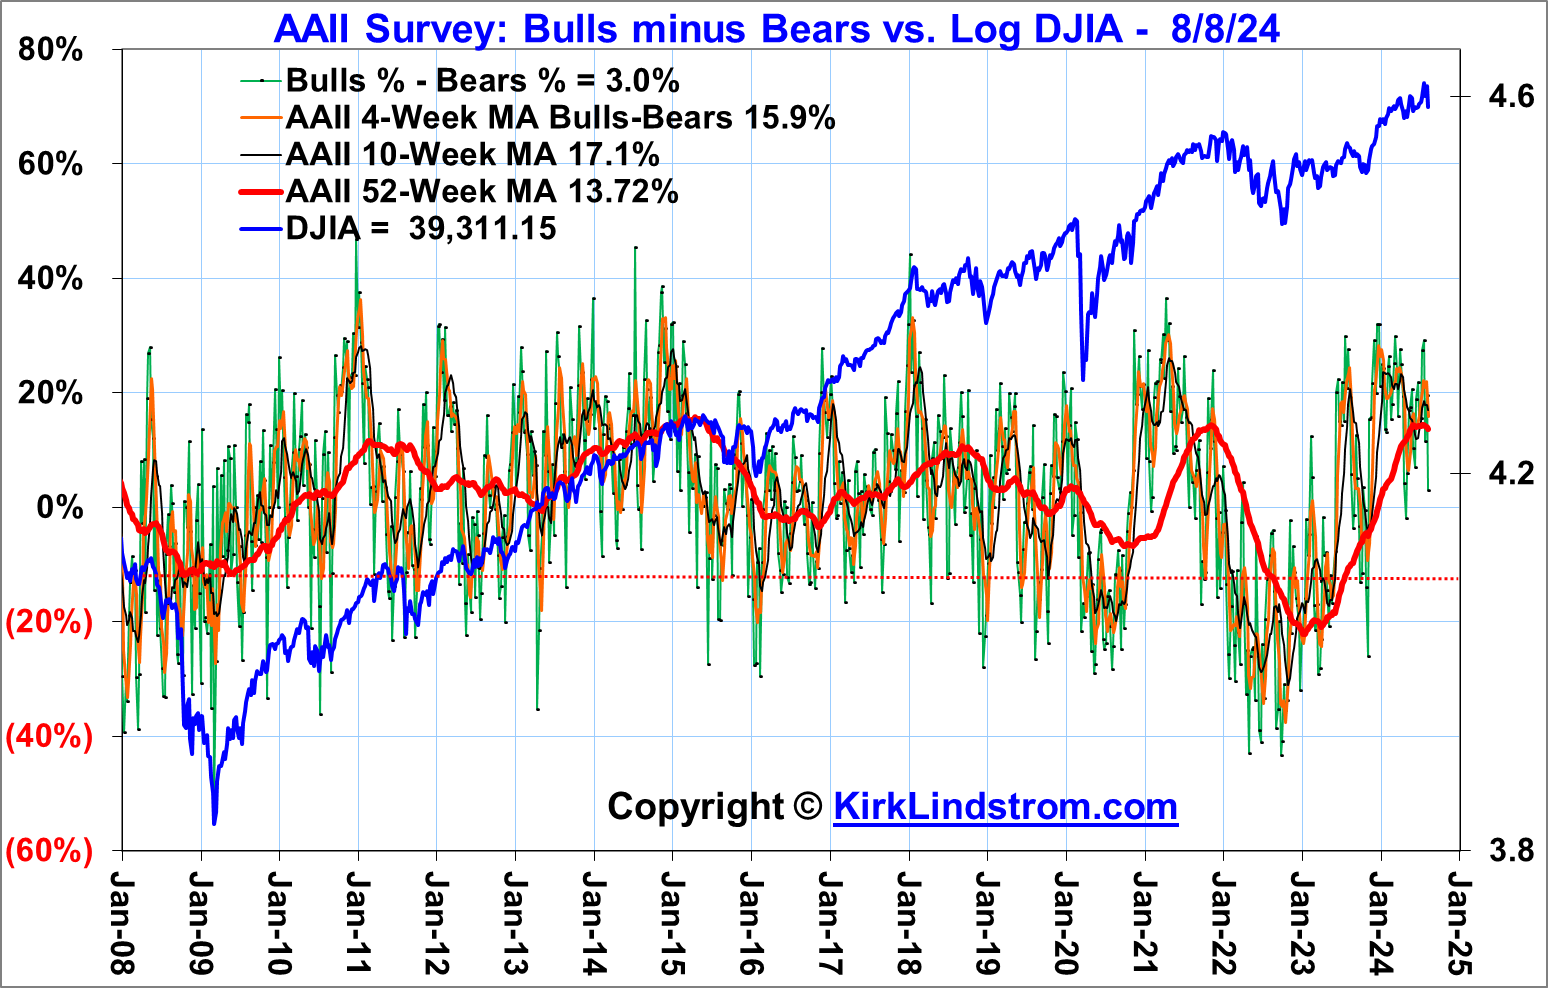
AAII Survey: Bulls & Bears


CPC Put Call Ratio 


Fear and Greed Index Fell to 20 this week and is currently at 22:
From https://www.cnn.com/markets/fear-and-greed


NAAIM EXPOSURE INDEX = 83.93: 
  • The NAAIM Exposure Index represents the average exposure to US Equity markets reported by our members.
  • https://naaim.org/programs/naaim-exposure-index/


2C-p = 7.8 is VERY Low:  
Invented by Tom Drake, the 2CS-p is the "5 day moving average of the product of the vix and p/c ratio."   The scale runs from 0 to 100% with 0% max bullishness and 100% max bearish reading for us contrarians.
To calculate 2C-p, Larbro explains: "Take each days p/c ratio and multiply it by that days vix. Take the sum of those results for that day and the previous 4 (5 total) and percentage rank them from 0% to 100% in terms of size against all the other data you have. The higher the numbers (5 day sum of p/c x vix), the higher the ranking. Then subtract that % ranking from 100% to "invert" the ranking so that lower 2c-p correspond to lows in the market and vice versa.
In my case they are ranked from today all the way back to Feb 10, 2003, the earliest I have data for. So in a nutshell if yesterday's 2c-p was 7.8% (which it is) that tells you that only 7.8% of the sum of the 5 day p/c x vix (aka the 2c-p) is lower than yesterdays value."


These charts are covered on page 6 of my newsletter with updates during the year for what the different types of sentiment charts mean to me. This is an easy place to give my subscribers updates of charts too numerous to add each month, especially after significant changes.                                                    
For more on investor sentiment and what it means to me, read my newsletter where 
  • Page 6 is dedicated to a monthly update on sentiment.
  • Page 12 summarizes sentiment and how it relates to five other "Market Factors" I follow to help set my asset allocation..

Subscribe NOW  and get
the
 August 2023 
Issue for FREE!!


Excerpt from my August 2024 Newsletter:

This is not an “exact science” so “all or nothing” market timing is foolish.

Market Timing Disclaimer: No sentiment indicator, or any indicator for that matter, is 100% reliable. I look at sentiment as head winds and tail winds. When sentiment is terrible, then it acts like a tail wind for your returns where you could see further declines, but long term, it is best to be buying when most others are selling. Likewise, if we see sentiment get too bullish, then I would consider lowering my portfolio asset allocation. It seldom pays to be buying stocks when EVERYONE is talking about stocks and how much money they are making at cocktail parties.

In addition, I am not market timing but for a small portion of my Explore Portfolio. I use market-timing indicators to tell me it is a good time to buy so I can add to positions when the market is down and thus help me overcome my fear to rebalance back to my target asset allocation. Likewise, when the market-timing indicators are saying to sell, they usually come when the markets are high where I want to be taking profits. The market timing indicators at market highs help me get over my greed and take profits.

Thursday, May 23, 2024

Kirk's Investor Sentiment & Other Charts

Market Sentiment Update 

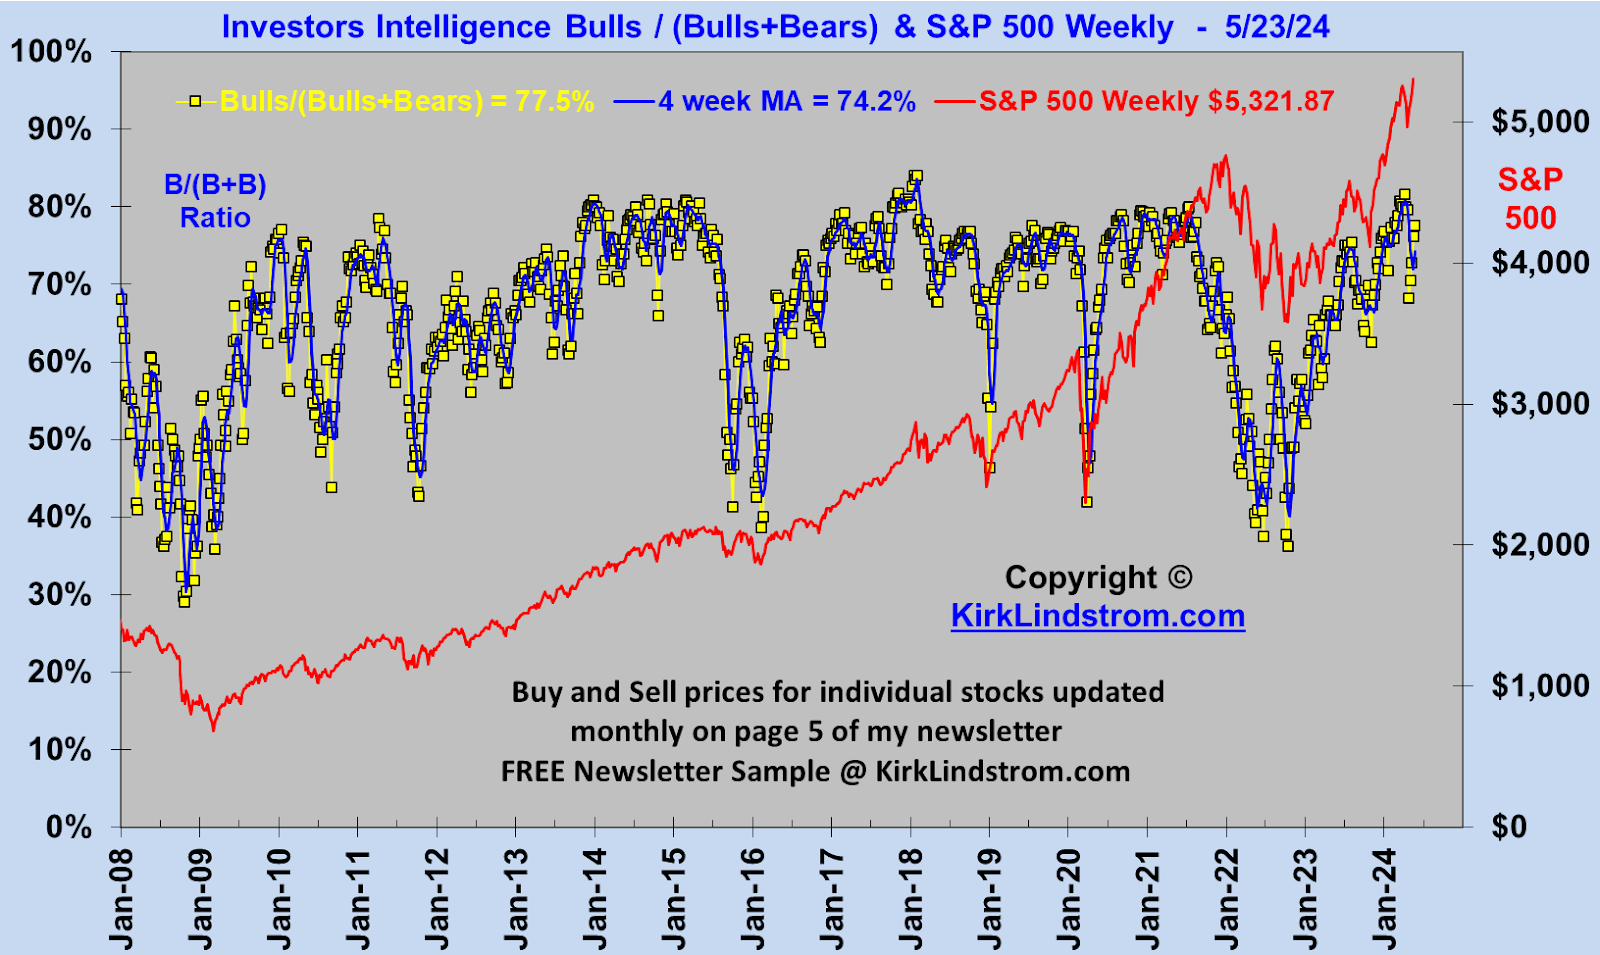
Investors Intelligence Bulls / (Bulls+Bears) & S&P 500 Weekly  -  5/23/24


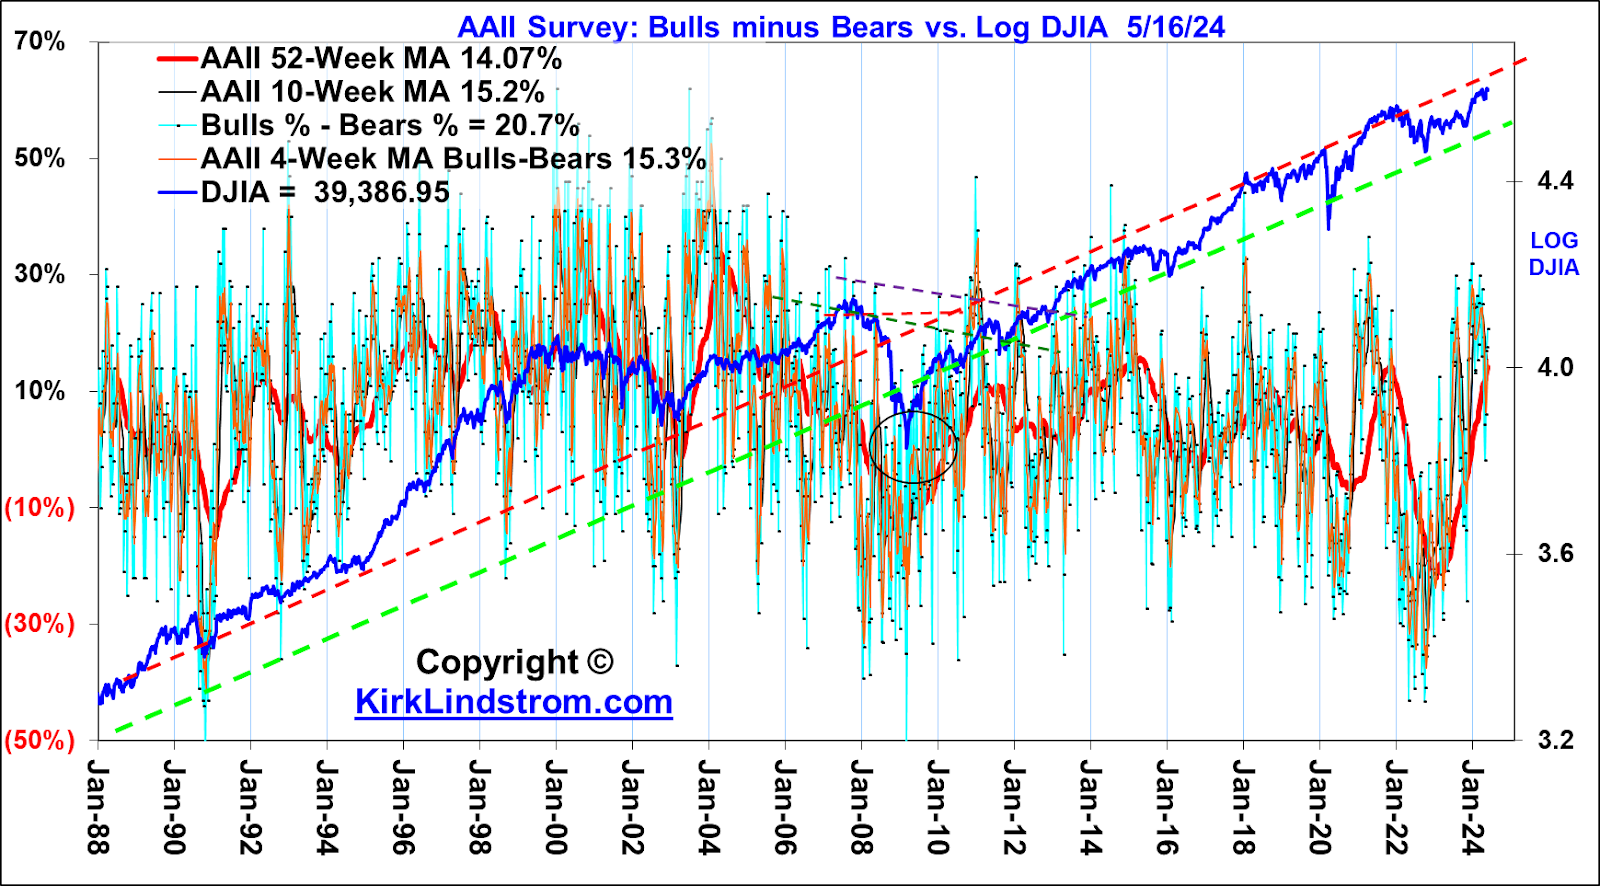
AAII Survey: Bulls minus Bears vs. Log DJIA - 1988 to Today


US Stock Markets (Log Scale) vs. Fed Funds Rate 


10-Yr & 30-Yr T-Bond Rates vs S&P 500


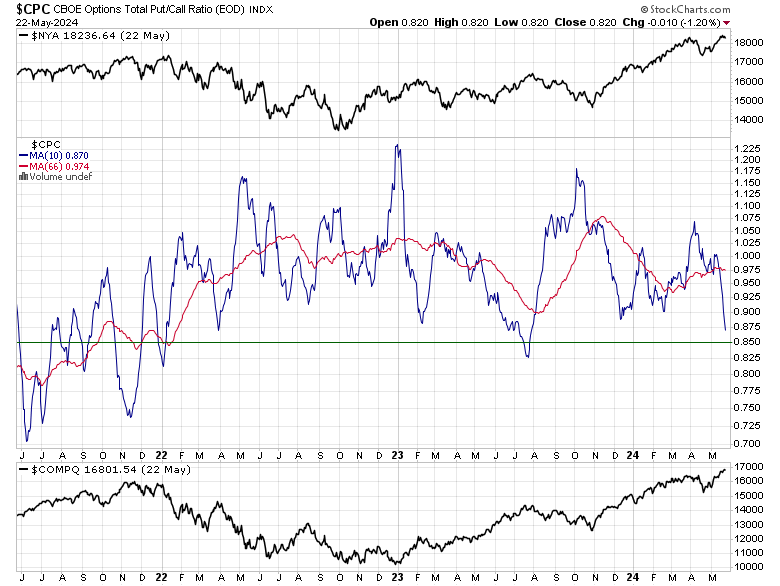
CPC Put Call Ratio 


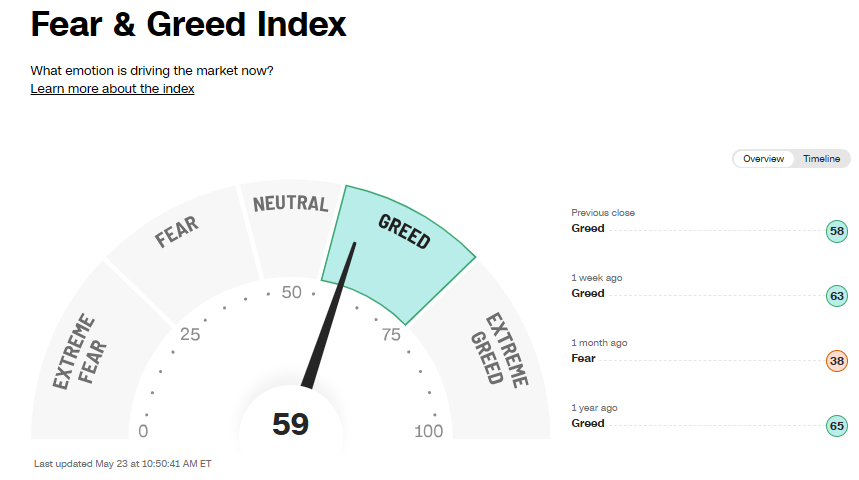
Fear and Greed Index @ 59
From https://www.cnn.com/markets/fear-and-greed


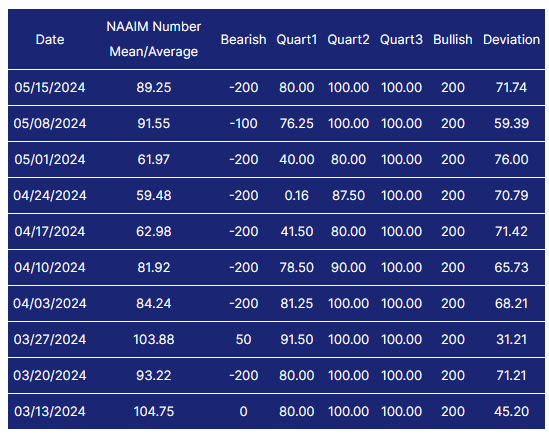
NAAIM EXPOSURE INDEX = 89.25: 
  • The NAAIM Exposure Index represents the average exposure to US Equity markets reported by our members.
  • https://naaim.org/programs/naaim-exposure-index/


2CS-p = 90.3 VERY high:  
Invented by Tom Drake, the 2CS-p is the "5 day moving average of the product of the vix and p/c ratio."   The scale runs from 0 to 100% with 0% max bullishness and 100% max bearish reading for us contrarians.


For more on investor sentiment and what it means to me, read my newsletter where 
  • Page 6 is dedicated to a monthly update on sentiment.
  • Page 12 summarizes sentiment and how it relates to five other "Market Factors" I follow.

Subscribe NOW  and get
the
 May 2023 
Issue for FREE!!


Kirk Lindstrom's Investment LetterTo see what stocks and ETFs are in my "Explore Portfolio" and get a full list of on my price targets to both take profits or buy more

Excerpt from my May 2024 Newsletter:

This is not an “exact science” so “all or nothing” market timing is foolish.

Market Timing Disclaimer: No sentiment indicator, or any indicator for that matter, is 100% reliable. I look at sentiment as head winds and tail winds. When sentiment is terrible, then it acts like a tail wind for your returns where you could see further declines, but long term, it is best to be buying when most others are selling. Likewise, if we see sentiment get too bullish, then I would consider lowering my portfolio asset allocation. It seldom pays to be buying stocks when EVERYONE is talking about stocks and how much money they are making at cocktail parties.

In addition, I am not market timing but for a small portion of my Explore Portfolio. I use market-timing indicators to tell me it is a good time to buy so I can add to positions when the market is down and thus help me overcome my fear to rebalance back to my target asset allocation. Likewise, when the market-timing indicators are saying to sell, they usually come when the markets are high where I want to be taking profits. The market timing indicators at market highs help me get over my greed and take profits.


Thursday, November 02, 2023

Kirk's Investor Sentiment Charts

 🐂📈Kirk Lindstrom's Investor Bull/Bear Sentiment Charts for 11/2/23 📉🐻

Reminder, you can follow this feed (subscribe for free) and get sent emails by Google when I post new charts and articles here. Just click "Follow" below.
11/2/23 Notes:
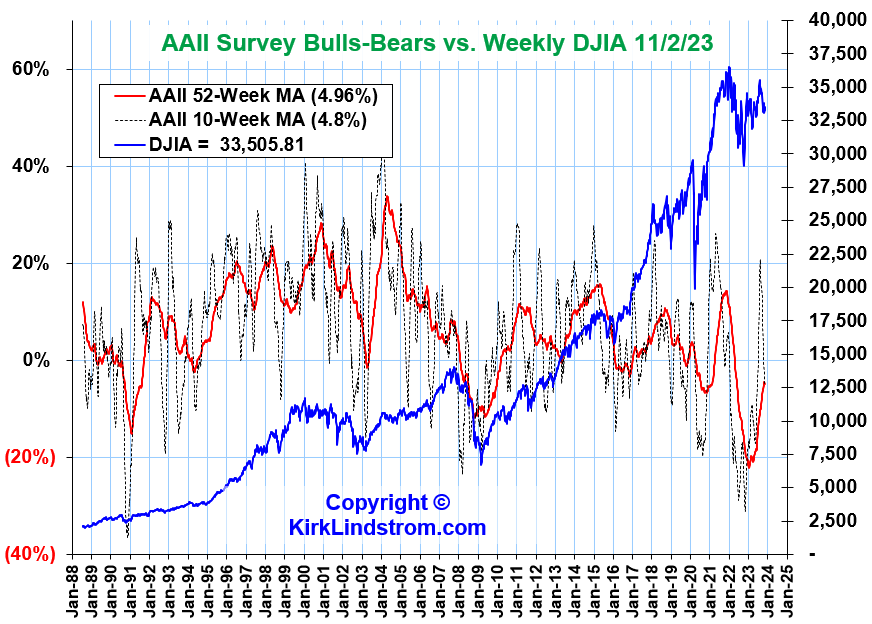
  • There is a large divergence between professional newsletter writers (II) and individual investors (AAII) sentiment.
  • II is "neutral" but its decline is large enough to support another rally.
  • AAII below negative 20% is bullish for contrarians
II Investors Intelligence & AAII (American Association of Individual Investors) Sentiment Updates.
Graphs below best viewed in full screen mode.

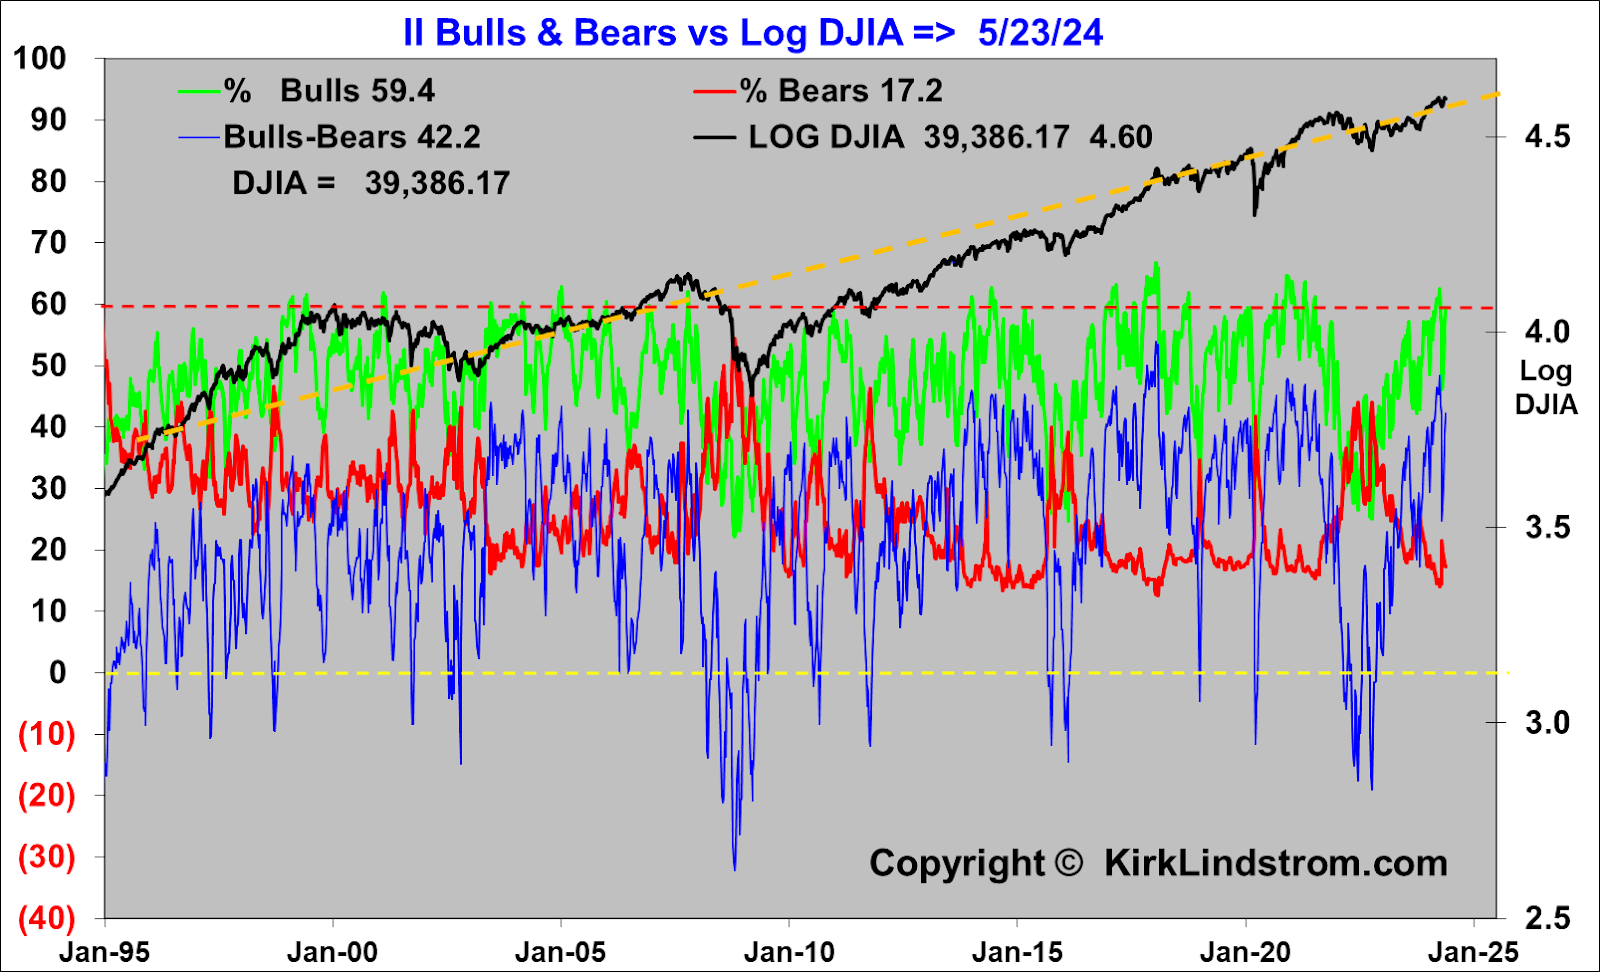
II Bulls and Bears Sentiment Graphs


AAII Bulls and Bears Sentiment Graphs: The AAII Investor Sentiment Survey measures the percentage of individual investors who are bullish, bearish, and neutral on the stock market for the next six months.

These charts are covered on page 6 of my newsletter with updates during the year for what the different types of sentiment charts mean to me. This is an easy place to give my subscribers updates of charts too numerous to add each month I cover.


To see what stocks and ETFs are in my "Explore Portfolio" and get a full list of on my price targets to both take profits or buy more:

 Subscribe NOW  and get
the
 November 2023 
Issue for FREE!!
(If you mention this ad)

Followers - Click "follow" to get an email alert for new articles

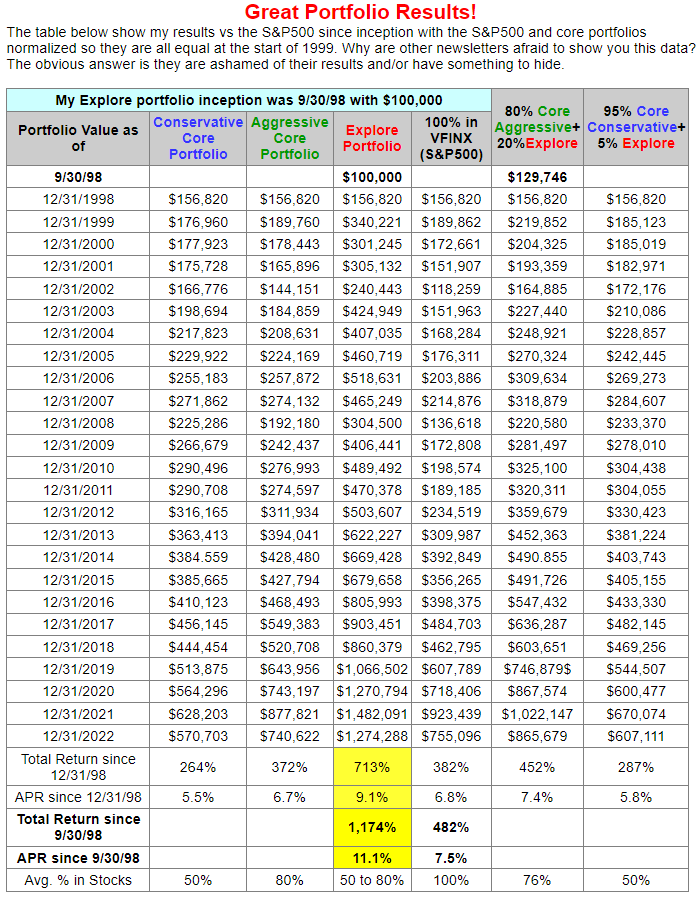
Kirk Lindstrom's Investment Letter Performance