Don't Miss Out On Great Gains! - Best Investment Newsletter


Click for FREE sample of Kirk Lindstrom's Investment Letter

Don't miss out! Subscribe Now

google.com, pub-7001134751860982, DIRECT, f08c47fec0942fa0

Search For More

Showing posts with label Market History. Show all posts

Saturday, June 04, 2022

Fed Funds Rate vs US Stock Market Indexes - Historical Charts

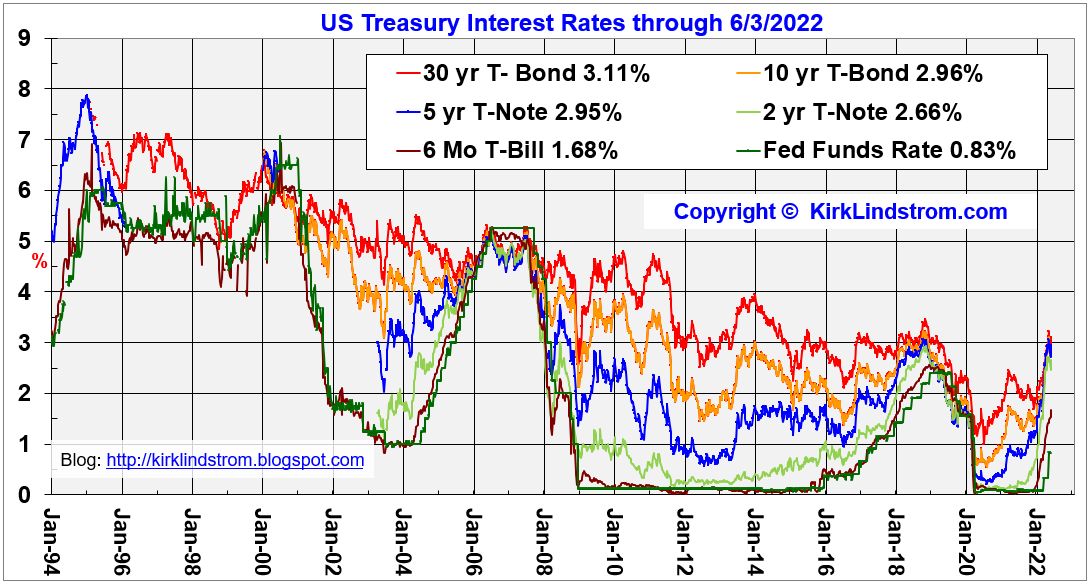
This chart shows the US Federal Funds Rate vs. the US stock market index values from 1993 through today.  The next three charts show the Dow, S&P 500, Nasdaq and Russell 2000 indexes over the same period.  The final chart shows US Treasury interest rates from 1994 through today.


US Stock Markets (Log Scale) vs. Fed Funds Rate 

DJIA chart showing Irrational Exuberance & Pessimism on a log scale


S&P 500 Intraday Prices - Log Scale


Nasdaq Composite - Intraday log chart


 US Treasury interest rates


end

Friday, May 07, 2010

May 6 Was Biggest DOW Decline in History

For the first time ever the Dow Jones Industrial Average (DJIA charts) fell by over 1,000 points during the trading day. From its intraday peak of 10,879.76 to its intraday low of 9,869.62 the DOW moved 1,010.14 points or 9.28%!

The biggest DOW percent decline in history occurred on Black Monday (October 19, 1987) with the DOW fell 508 points to 1738.74 for a decline of 22.61%!

 DOW YTD Chart
 click charts for full size images
 
DJIA Intraday Chart

Dow Jones Industrial Average
May 6 Closing Value: 10,520.32
Change: Down 347.80 points or 3.20%
Previous Close: 10,868.12
May 6 Opening Value: 10,862.22
May 6 Range: 9,869.62 - 10,879.76 or  1,010.14 points
52 week Range: 8,057.57 - 11,309.00

There is a lot of finger pointing in the news about who to blame for this decline but a picture of the DOW year-to-date shows the market found a bid at its February closing low.  


Biggest Dow Point Drops in History

Below are the biggest closing point drops in the history of the Dow Jones Industrial Average.
DateClosePoints /   %  
9/29/200810365.45-777.68 / -6.98%
10/15/20088577.91-733.08 / -7.87%
9/17/20018920.70-684.81 / -7.13%
12/1/20088149.09-679.95 / -7.70%
10/9/20088579.19-678.91 / -7.33%

Since 12/31/98 "Kirk's Newsletter Explore Portfolio" is UP 159% (a double plus another 59%!!) vs. the S&P500 UP a tiny 8.6% vs. NASDAQ UP a tiny 3.5% (All through 12/31/09) 

In 2009, "Kirk's Newsletter Explore Portfolio" gained 33.5% vs. the DJIA up 18.8% 
Subscribe NOW and get the May 2010 Issue for FREE! !


Tuesday, January 06, 2009

DOW Annual Performance Following A 15% or More Annual Decline

Last year's 33.8% decline in the DOW tied for third with 1930 for the worst annual declines in the DJIA. Can we draw any conclusions about the future from the past?

This chart from Schaeffer Research shows the annual return of the DJIA following the largest annual declines that range from -15.4% in 1941 to -52.7% in 1931.

The table shows that following annual declines of over 30% the market in the following year gained anywhere between a loss of 52.7% and a gain of 81.7%.

After an annual decline of 15% or more, four times the losses were 20% or more and four times the next year saw gains of at least 40%.

Only a monkey with a dart can make a prediction for next year based on that data!

Sunday, March 16, 2008

The Yield Curve Spread as a Market Predictor

This graph shows the 30-Year Treasury Bond (T-Bond) interest rate divided by the 3-month Treasury Bill (T-Bill) discount rate with the S&P500 price on the same graph.

Click chart courtesy of StockCharts.com to see it full sized.

Historically, periods with an inverted yield curve (circled areas) have been followed by a recession and falling stock prices.

The chart may speak for itself but to get my take on what this chart indicates for the future, read the April 2008 edition of "Kirk's Investment Newsletter" due out around Easter which is March 23 this year.

Saturday, December 01, 2007

Number of New Lows on NYSE above 450


Click to see full sized chart courtesy of stockcharts.com


This chart shows the number of NYSE stocks that are making new 52 week lows (red spikes) plotted with the S&P500 in black. You can see from the chart that spikes above 450 new lows are fairly rare. The chart also shows that buying after these spikes retreat has provided great returns in the short term (2001) and often in the long term (1994, 1998, 2002, 2004 and hopefully now in 2007.)


I believe this chart is more evidence that the market is trying, as odd as it seems near all time highs for the averages, to make a very major bottom similar to the 1998 and 2002/2003 bottoms.

Most really good bottoms before major advances are double or triple bottoms. 1998 was a double bottom and 2002/3 was a triple bottom with two significant lows made in 2002 and a test of those lows, about 4% higher, in 2003.

Also of note is this attempt to make a major bottom is coming on what I call a test of the breakout above the 2000 highs.

The bears will say the market is making a double top before crashing as the market comes apart.

Tuesday, November 13, 2007

Number of New Lows on NYSE above 450

This chart shows the number of NYSE stocks that are making new 52 week lows (red spikes) plotted with the S&P500 in black. You can see from the chart that spikes above 450 new lows are fairly rare. Last Friday (Nov. 9, 2007) the NYSE made a second spike above 450 in just a few months!
Click to see full sized chart courtesy of stockcharts.com

I believe this chart is more evidence that the market is trying, as odd as it seems near all time highs for the averages, to make a very major bottom similar to the 1998 and 2002/2003 bottoms.

Most really good bottoms before major advances are double or triple bottoms. 1998 was a double bottom and 2002/3 was a triple bottom with two significant lows made in 2002 and a test of those lows, about 4% higher, in 2003.

Also of note is this attempt to make a major bottom is coming on what I call a test of the breakout above the 2000 highs.

The bears will say the market is making a double top before crashing as the market comes apart.

Sunday, October 21, 2007

Black Monday 1987 Graphs

Charts of the markets for Black Monday October 19, 1987.

Two year graphs from one year before through one year after Black Monday.

S&P500 Click to see in more detail

S&P500 & DJIA
Click to see in more detail

DJIA - Dow Jones Industrial Average
Click to see in more detail

Sunday, October 14, 2007

20 Years After Black Monday: October 19, 1987

As I write this, the stock market is near an all time record high just like it was on Black Monday in 1987. On October 19, 1987 (Black Monday) the US stock market fell 22% in a single day. Can do the market do the same now, twenty years later?

Circuit breakers and trading curbs should prevent another 22% single day fall that came from sellers wanting out at any price while buyers were nowhere to be found, but nothing is impossible.

Back in 1987, the Standard & Poor's 500 traded at over 22 times earnings while Treasury bond yields hit 10%. Today the S&P500 trades at about 18 times earnings and long-term treasury bonds yield less than 5%. The "Fed Model" (that I update each month in "Kirk Lindstrom's Investment Newsletter") says the earnings yield in a fairly valued market should be equal to the ten-year US Treasury Bond rate.

In 1987:
  • PE was 22
  • Earnings Yield = 1/PE
  • 1/PE = 1/22 = 0.0455
  • 0.0455 x 100% = 4.55%
  • 10-year Treasury = 10%
  • Over Valuation = 10% / 4.55% = 2.2

Today:

  • PE is 18
  • Earnings Yield = 1/PE
  • 1/PE = 1/18 = 0.0556
  • 0.0556 x 100% = 5.56%
  • 10-year Treasury = 4.68%
  • Over Valuation = 4.68% / 5.56% = 0.84

According to the very simple application of the Fed Model, the market was overvalued by a factor of 2.2 in 1987 and is under valued today by 16%.

To get more detailed monthly updates on the Fed Model and more, subscribe NOW and get the October issue of “Kirk Lindstrom's Investment Newsletter") for FREE!

Tuesday, September 18, 2007

Chart of Stock Markets vs Fed Funds Rate

Click chart to see it full sized

The Federal Reserve cut its Fed Funds interst rate today from 5.25% to 4.75% and they cut their discount rate to from 5.75% to 5.25%. Below is the text of their statement explaining their actions.

Release Date: September 18, 2007

  • For immediate release
    .
    The Federal Open Market Committee decided today to lower its target for the federal funds rate 50 basis points to 4-3/4 percent.
    .
    Economic growth was moderate during the first half of the year, but the tightening of credit conditions has the potential to intensify the housing correction and to restrain economic growth more generally. Today’s action is intended to help forestall some of the adverse effects on the broader economy that might otherwise arise from the disruptions in financial markets and to promote moderate growth over time.
    .
    Readings on core inflation have improved modestly this year. However, the Committee judges that some inflation risks remain, and it will continue to monitor inflation developments carefully.
    .
    Developments in financial markets since the Committee’s last regular meeting have increased the uncertainty surrounding the economic outlook. The Committee will continue to assess the effects of these and other developments on economic prospects and will act as needed to foster price stability and sustainable economic growth.
    .
    Voting for the FOMC monetary policy action were: Ben S. Bernanke, Chairman; Timothy F. Geithner, Vice Chairman; Charles L. Evans; Thomas M. Hoenig; Donald L. Kohn; Randall S. Kroszner; Frederic S. Mishkin; William Poole; Eric Rosengren; and Kevin M. Warsh.
    .
    In a related action, the Board of Governors unanimously approved a 50-basis-point decrease in the discount rate to 5-1/4 percent. In taking this action, the Board approved the requests submitted by the Boards of Directors of the Federal Reserve Banks of Boston, New York, Cleveland, St. Louis, Minneapolis, Kansas City, and San Francisco.
Kirk's Comments: I view this is positive as the Fed is taking action to help the credit markets and it has returned its bias to "neutral." What this all means to the stock markets is discussed in my October newsletter I am writing now and hope to release by the weekend. Subscribe now and get my list of stocks I think will benefit from today's action.


    Tuesday, September 11, 2007

    In Memory of 9/11 - A look back at 9/11/06 Six Years Later

    My reflection on that horrible day six years ago.

    September 11, 2007:

    I'll never forget that day.

    Listening to Mark Hanes on CNBC cover the story in disbelief as the second tower started to smoke and we thought it was bombs inside...

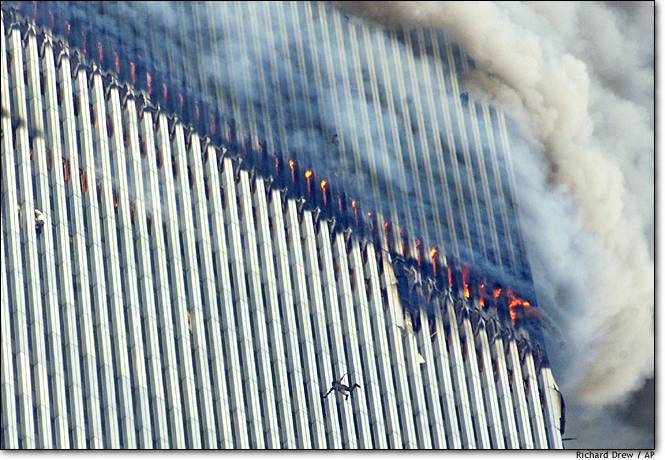
    Watching the people jump out of the WTC as it burned down...

    Wondering if Lakshman was OK...he was there for a meeting.....

    Then learning planes flew into the towers, not bombs. Terrorists piloting bombs with wings.

    Then learning the Pentagon was hit by a plane

    Then learning a plane went down in a field in Pennsylvania. Such brave people to bring their plane down before the hijackers could finish their deadly mission.

    Then seeing the towers collapse..

    One of the few times in my life I remember crying as events unfolded....

    Is that how my grandparents remembered Pearl Harbor?

    I recorded my thoughts as we all watched in horror here.

    September 11, 2001 6:13 AM
    1. Kirk - World Trade Center
    I was watching CNBC showing one tower of the World trade center on fire when the other tower exploded!
    Maria B called in and said she saw a 2nd plane fly into the 2nd tower!
    As I was watching the futures crashed....
    CRAP!

    September 11, 2001 6:50 AM
    5 Kirk - Pentagon has been hit!
    The pentagon is on fire.

    7. September 11, 2001 6:53 AM
    Kirk - White house being evacuated
    Capital building also evacuated.
    Warning.
    Don't go near any major landmarks!
    Center of US Financial Markets - World Trade Center - Attacked and on fire.
    NYC shut down, can't get in or out...
    Tunnels closed...
    Center of US Military Power attacked.
    People being reported dropping out of WTC to avoid the heat!
    Jumping to their quicker deaths...
    (picture of Trade Center Burning and people jumping to their deaths)
    Sad... very, very sad. (picture)

    Followers - Click "follow" to get an email alert for new articles

    Kirk Lindstrom's Investment Letter Performance