Don't Miss Out On Great Gains! - Best Investment Newsletter


Click for FREE sample of Kirk Lindstrom's Investment Letter

Don't miss out! Subscribe Now

google.com, pub-7001134751860982, DIRECT, f08c47fec0942fa0

Search For More

Showing posts with label Monthly Treasury Statement. Show all posts

Tuesday, June 13, 2023

Treasury Revenue Falls, Spending Rises and Deficit Soars

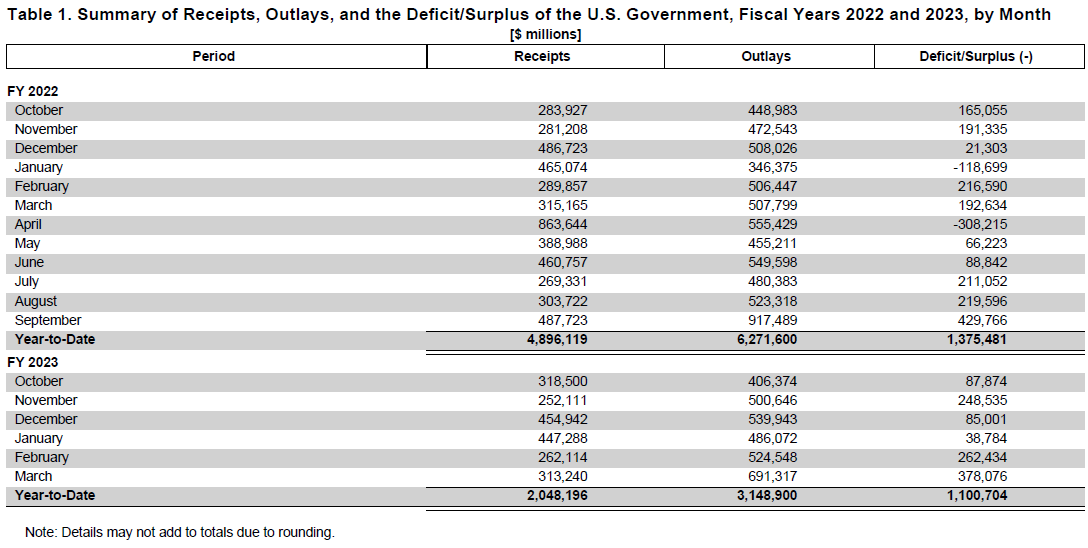
6/13/23 Updated Summary of Receipts, Outlays, and the Deficit/Surplus of the U.S. Government by Month.: 

Key Points:

  • For FY 2023, total taxes and other revenues collected YTD are down 11.3% year-over-year.  
  • Just as big a "problem" is SPENDING grew 9.4%!  
  • Spending is up about 5.4% above the 4.0% year over year CPI inflation rate reported this morning.
  • The deficit is up 27.1% in just a year!
This table shows a summary of receipts, outlays, and the deficit for the U.S. Government by Month.


To see what stocks and ETFs are in my "Explore Portfolio" and get a full list of on my price targets to both take profits or buy more:
 Subscribe NOW  and get
the
 June 2023 
Issue for FREE!!! 
(If you mention this ad)
x

Wednesday, April 12, 2023

Treasury Revenue Falls For Fifth Consecutive Month

I updated my revenue, spending & deficit table for the US Treasury with the latest numbers.

  • Revenue (taxes and fees) is not keeping up with inflation much less growing as you would expect if the economy was healthy
  • Spending is soaring, much like a recession.
  • Deficits, as a result, have already soared to $1.1 Trillion at the half way mark of fiscal 2023 while they didn't pass $1 trillion until the 12 month of fiscal 2022.
Clearly, with five months of declining treasury revenue which is mostly individual and payroll taxes, we are in a tax recession already.

With requirements for "Estimated Tax Payments" to be paid four times a year, this is usually a very "lumpy" series thus I add calculations to show how these data change for the same period in the prior year.  For example, April 2022 saw revenue increase by 96.6% as many tax payers paid their capital gains taxes on their fantastic 2021 gains.  What I look for is trends such as the current trend of Treasury Revenue falling month-over-month for five consecutive months despite inflation of over 5% during that period.  If we were to adjust the March 2023 reading by March's 5.0% inflation, "real revenue" collected by the Treasury fell by 5.6% which is hardly a healthy economy.


A healthy, growing US economy should have this revenue moving higher to match GDP growth, which is inflation adjusted, plus inflation. 


Selected excerpts from the Monthly Treasury Statement

Cumulative Receipts, Outlays, and Surplus/Deficit through Fiscal Year 2023


Note how this next graphic shows the March 2023 deficit is already larger than the August 2022 deficit:

Kirk Lindstrom's Investment Letter

To see what stocks and ETFs are on my buy list and what are my price targets:
 Subscribe NOW  and get
the
 April 2023 
Issue for FREE!!!
(If you mention this ad)

xxx

Friday, May 10, 2019

April Treasury Revenue up 4.9% while Spending Soars 7.6%

My table below shows a "Summary of Receipts, Outlays, and the Deficit/Surplus of the U.S. Government by Month Through April 2019."  

Monthly US Treasury Statement Calculations
  • A staggering 20.6 cents of ever dollar spent so far in fiscal 2019 came from new borrowing!
Year over year change  for April:
  • Monthly revenue (taxes, fees and tariffs) grew 4.9% over 2019
  • Monthly spending grew 7.6% vs 2019
  • The monthly deficit fell 25.2% vs 2019 
  • but year over year the total deficit grew 37.7%!!!
Summary of Receipts, Outlays, and the Deficit/Surplus of the U.S. Government by Month. [$ millions]

The Monthly Treasury Statement summarizes the financial activities of the federal government and off-budget federal entities and conforms to the Budget of the U.S. Government.

FULL Year Summary:


FULL Year Summary Stated as a Family Budget:


You can never have too much data so I process the latest reports to see tax collections, spending and the official deficit behaves without "noise" from the obviously biased MSM "Main Stream Media."

Don't miss out!

And get the May 2019 Issue for FREE!

Wednesday, March 06, 2019

2019 January Treasury Surplus Smaller than January 2018 - Government Shutdown to Blame?

My table below shows a "Summary of Receipts, Outlays, and the Deficit/Surplus of the U.S. Government by Month Through January 2019."

Unfortunately, the "Estimated Tax Payment" for the 2018 tax year that I (and others) sent in January 2019  to the US Treasury was not large enough to cause the surplus to grow compared to January 2018.  Was the government shutdown to blame?

The Monthly Treasury Statement summarizes the financial activities of the federal government and off-budget federal entities and conforms to the Budget of the U.S. Government.

You can never have too much data so I process the latest reports to see tax collections, spending and the official deficit behaves without "noise" from the obviously biased MSM "Main Stream Media."
Table 1
Summary of Receipts, Outlays, and the Deficit/Surplus of the U.S. Government by Month. [$ millions]
From the data in Table 1, you can clearly see:
  • Taxes collected in January 2019 were lower than taxes collected in January 2018 
  • It is possible this decline is due to the government shutdown so we'll have to keep an eye on the data to see if it recovers now that the government is open for business again.

From the data in Table 2, you can clearly see:

  • Tax collections during the first four months of fiscal 2018 grew year over year and month over month over fiscal 2017 but
  • after a good start in October of FY-2019 with monthly tax collection growth of 7.41%, tax collections have fallen on a monthly basis and
  • tax collections on a year over year basis fell by 1.7%, the first decline since March of FY-2017 when they fell by 0.2%.  

The worst news is the deficit continues to grow at an alarming rate.  

The good news is the US Stock Market, so far, doesn't seem to mind as long as interest rates remain relatively low and the Fed remains in a "holding pattern" where it does not raise the Fed Funds rate until we get by this "soft spot" in the US and global economy.


Don't miss out!


NOTE: Due to the lapse in appropriation, the dates for publication of the Monthly Treasury Statement (MTS) for December, January, and February have changed. Here are the revised dates:
  • December MTS – Publish on 2/13
  • January MTS – Publish on 3/5
  • February MTS – Publish on 3/22
  • March MTS – On normal schedule

Wednesday, February 13, 2019

Despite Higher Tax Revenue, The US Deficit Continued to Expand in December 2018

My table below shows a "Summary of Receipts, Outlays, and the Deficit/Surplus of the U.S. Government by Month Through December 2018."

The Monthly Treasury Statement summarizes the financial activities of the federal government and off-budget federal entities and conforms to the Budget of the U.S. Government.

You can never have too much data so I process the latest reports to see tax collections, spending and the official deficit behaves without "noise" from the obviously biased MSM "Main Stream Media."

From the data, you can clearly see:

  • Taxes collected in December 2018 were higher than taxes collected in December 2017 
  • Taxes collected in December 2017 were higher than taxes collected in December 2016


Thus, despite lower tax rates on individuals and corporations due to the "Tax Cuts and Jobs Act of 2017", the total tax revenue collected by the US Treasury rose.

Unfortunately,
  • Spending in December 2018 was higher than spending in December 2017
  • Spending in December 2017 was higher than spending in December 2016

So the deficit continues to grow (at an alarming rate) but the Stock Market doesn't seem to mind as long as interest rates remain relatively low.


 Subscribe NOW and get the February 2019 Issue for FREE!!!


Interest Rates
S&P 500 Index

NOTE: Due to the lapse in appropriation, the dates for publication of the Monthly Treasury Statement (MTS) for December, January, and February have changed. Here are the revised dates:

  • December MTS – Publish on 2/13
  • January MTS – Publish on 3/5
  • February MTS – Publish on 3/22
  • March MTS – On normal schedule

Followers - Click "follow" to get an email alert for new articles

Kirk Lindstrom's Investment Letter Performance