Don't Miss Out On Great Gains! - Best Investment Newsletter


Click for FREE sample of Kirk Lindstrom's Investment Letter

Don't miss out! Subscribe Now

google.com, pub-7001134751860982, DIRECT, f08c47fec0942fa0

Search For More

Showing posts with label ECRI WLI Data. Show all posts

Friday, January 21, 2022

Saturday, September 01, 2018

ECRI Warns Elevated Risk of 10 to 20% Correction

Lakshman Achuthan, managing director at the Economic Cycle Research Institute or ECRI told CNBC yesterday that the US stock market is facing elevated risk of 10 to 20 percent correction.
Click for Full Sized Images
We ALREADY had a 12% decline  and the market is just pulling above its prior high.  
The stock market is part of ECRI's leading indicators so its new highs could also be signaling that ECRI's Weekly Leading Index (WLI) growth rate is about to bottom.  


Stock market facing elevated risk of 10-20 percent correction, economic forecaster says from CNBC.

So the question remains is a second decline over 10%  this year about to start? 

 Subscribe NOW  and get
the
 August 2018 
Issue for FREE!!!


Friday, January 13, 2017

ECRI's Weekly Leading US Index Up to a New Record High

The Economic Cycle Research Institute, ECRI -- a New York-based independent forecasting group, released its latest readings for its proprietary Weekly Leading Index (WLI) today.

For the week ending January 6, 2017:

  • WLI was 144.9 up slightly from the prior week's reading of 144.6
  • WLI Growth was 12.2%, up from the prior week's reading of 12.0%.
Here is my chart of weekly WLI and its growth rate compared to quarterly US GDP back to 1994:

Chart of WLI and WLI growth vs GDP Growth (click charts to expand)

This is ECRI's chart showing WLI's weekly growth rate back to 1974:
Weekly ECRI Press Release Graph


Weekly ECRI vs the S&P500 and GDP Growth
Newsletter Special!
Subscribe to my Newsletter NOW
and get the January 2017 Issue for FREE!!


Notes:
  1. Occasionally the WLI level and growth rate can move in different directions, because the latter is derived from a four-week moving average.
  2. ECRI uses the WLI level and WLI growth rate to HELP predict turns in the business cycle and growth rate cycle respectively. Those target cycles are not the same as GDP level or growth, but rather a set of coincident indicators (including production, employment income and sales) that make up the coincident index. Based on two additional decades of data not available to the general public, there are a couple of occasions (in 1951 and 1966) when WLI growth fell well below negative ten, but no recessions resulted (although there were clear growth slowdowns).
  3. For a better understanding of ECRI's indicators, read their book, "Beating the Business Cycle: How to Predict and Profit From Turning Points in the Economy
ECRI's Book

is Available on Kindle

Saturday, April 26, 2014

ECRI Weekly Leading Index WLI Lower but Growth is Up

The Economic Cycle Research Institute, ECRI -- a New York-based independent forecasting group, released its latest readings for its proprietary Weekly Leading Index (WLI) Friday.

For the week ending April 18, 2014:
  • WLI was 134.6 down slightly from the prior week's reading of 1134.9
  • WLI Growth was 4.1%, up from the prior week's reading of 3.9%.
Chart of WLI and WLI growth vs GDP Growth 
(click charts to expand)

Weekly ECRI Press Release Graph

 Weekly ECRI vs the S&P500 and GDP Growth
Notes:
  1. Occasionally the WLI level and growth rate can move in different directions, because the latter is derived from a four-week moving average.
  2. ECRI uses the WLI level and WLI growth rate to HELP predict turns in the business cycle and growth rate cycle respectively. Those target cycles are not the same as GDP level or growth, but rather a set of coincident indicators (including production, employment income and sales) that make up the coincident index. Based on two additional decades of data not available to the general public, there are a couple of occasions (in 1951 and 1966) when WLI growth fell well below negative ten, but no recessions resulted (although there were clear growth slowdowns).
  3. For a better understanding of ECRI's indicators, read their book, "Beating the Business Cycle: How to Predict and Profit From Turning Points in the Economy
ECRI's Book

is Available on Kindle

Monday, April 30, 2012

ECRI's WLI and Deficit Spending

ECRI's WLI Moves Higher; Q1 GDP Positive Due To Deficit Spending
For the week ending April 20, 2012:
  • WLI increased to 124.1, up 0.3 from the prior week's reading of 123.8.
  • WLI growth fell to a positive 0.6%, down from last week's reading of 1.2%. 
  • First estimate of Q1-2012 GDP Growth is only 2.2%
ECRI WLI & WLI Growth vs. US GDP Growth

GDP, WLI and Deficit Spending

As my graph above shows, GDP turned lower as you would expect with the lower WLI readings, but it remains firmly in positive territory. The US economy has not entered a recession but it is painfully low.
Actual GDP in Q1-2012 was $15.462 trillion compared to $14.868 trillion in Q1-2011. The difference is $594 billion, less than the current 6 month deficit of $779 billion I show in the second chart in the Seeking Alpha article "U.S. Borrows 53.7 Cents Of Every Dollar Spent In March." Clearly, we would be in a recession that ECRI predicted if not for deficit spending.

A "Failure of Leadership"
The fact that we are here today to debate raising America's debt limit is a sign of leadership failure. It is a sign that the US Government cannot pay its own bills. It is a sign that we now depend on ongoing financial assistance from foreign countries to finance our Government's reckless fiscal policies. Increasing America's debt weakens us domestically and internationally. Leadership means that, "the buck stops here.' Instead, Washington is shifting the burden of bad choices today onto the backs of our children and grandchildren. America has a debt problem and a failure of leadership. Americans deserve better. I therefore intend to oppose the effort to increase America’s debt limit. ~ Senator Barack H. Obama, March 2006

Sunday, February 12, 2012

ECRI's WLI and WLI Growth Continue Higher

The Economic Cycle Research Institute, ECRI -- a New York-based independent forecasting group, released its latest readings for its proprietary Weekly Leading Index (WLI) Friday.
For the week ending February 3, 2012:
  • WLI is 123.3 up from the prior week's reading of 123.0.
Chart of WLI and WLI growth vs GDP Growth
(click charts to expand)
Since ECRI releases WLI numbers for the prior week and the stock market is known in real time, you can sometimes get a clue for next week's WLI from the weekly change in the S&P500 or its exchange traded fund, SPY. Notably, in the lead-up to the last two recessions, the WLI turned down months before the stock market did.
Chart of S&P500 vs ECRI's WLI
ECRI has not publicly backed off their most recent call for a recession. They were correct with their recession call in early 2008, while the S&P500 rallied to the dashed blue resistance (now support) line on the chart above.
Could they be wrong this time?
By climbing to new highs with dividends reinvested, the stock market sure seems to act like it thinks we will avoid a recession.

See my full article:

Keep An Eye on SPY: ECRI's Weekly Leading Index Rises
Long Term Results that Speak for Themselves
Since 9/30/98 inception, "Kirk's Newsletter Explore Portfolio" is UP 390%
vs. the S&P500 UP only 51% vs. NASDAQ UP only 57% (All through 12/31/11) 
(More Info, Testimonials & Portfolio Returns)
Latest 2012 Update:  Up 10% YTD  as of 2/12/12

Subscribe NOW and get the February 2012 Issue for FREE! !  


Friday, March 04, 2011

ECRI's WLI Growth Rate at 42 Week High

The Economic Cycle Research Institute, ECRI - a New York-based independent forecasting group, released its latest readings for its proprietary Weekly Leading Index (WLI) this morning.
For the week ending February 25, 2011:
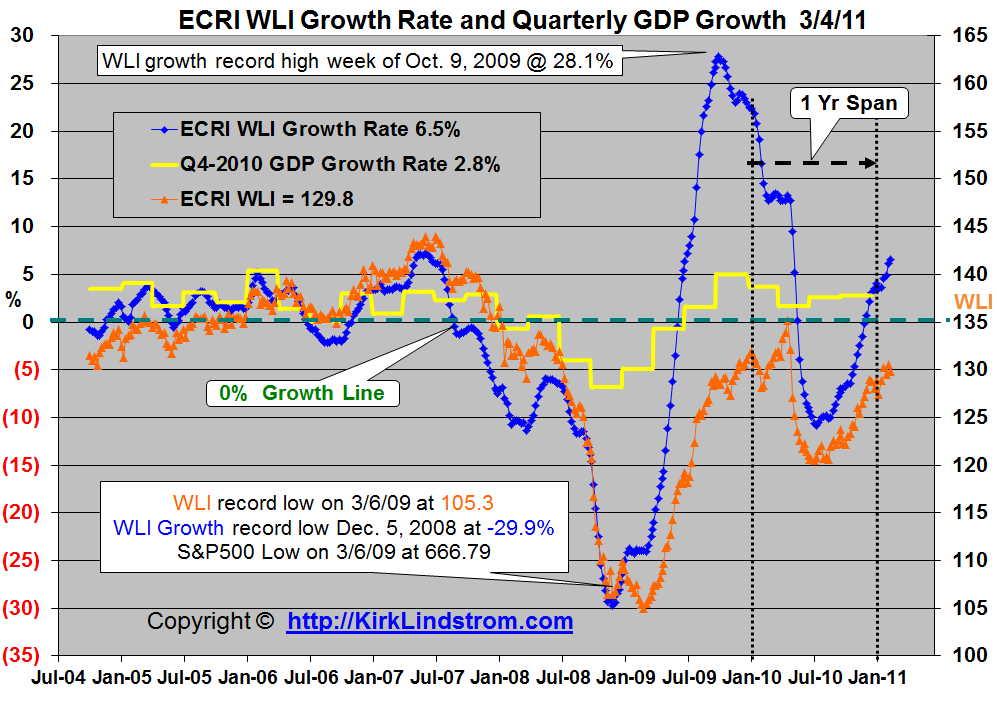
  • WLI is 129.8 down from the prior week's reading of 130.5
  • Last week marked a 42 week high for WLI. Its last higher reading was for the week ending May 7, 2010, when it was at 132.1
  • The lowest reading for WLI on record was 105.3 for the week ending March 6, 2009.
  • WLI growth of 6.5% is up from last week's reading of 6.1%
  • This marks a 42-week high for WLI Growth.
  • The lowest reading for WLI growth on record was -29.9% on December 5, 2008. It turned higher months before the stock market [S&P500 (SPY)] bottomed on March 6, 2009, at 666.79.
On February 13, 2011, Lakshman Achuthan, co-founder and Chief Operations Officer of ECRI was a guest on the national radio show "Moneytalk with Bob Brinker." During the interview with substitute hostess Lynn Jimenez, Mr Achuthan said now was the time to take risk because the economy will get better before it will get worse. He suggested listeners should "Look to take more risk now because we should boom before the next bust." and "get while the getting is good."

Chart of WLI and WLI growth vs GDP Growth
(Click charts to enlarge)

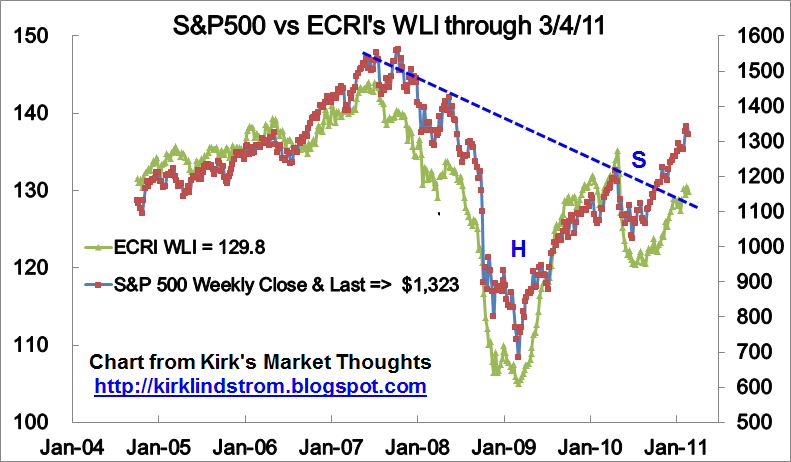
Since ECRI releases WLI numbers for the prior week and the stock market is known in real time, you can sometimes get a clue for next week's WLI from the weekly change in the stock market. Notably, in the lead-up to the last two recessions, the WLI turned down months before the stock market did.
Chart of S&P500 vs ECRI's WLI

I want to point out that a correction in the stock market now would not necessarily change ECRI's call for an economic growth rate revival. It takes a "pervasive" (for the majority) change of direction of indicators in a "pronounced and persistent" way for ECRI to call for a turn in the economic cycle. These indicators and the trigger levels are proprietary. I have found no one who has duplicated them or ECRI's success in calling business cycle turns based on its reading of its indicators.
Note that the chart above of the S&P500 vs. WLI shows a breakout above the dashed blue line that represents the neckline for a "Head and Shoulders Bottom" pattern. This is a very bullish development. A correction to test the pattern from above with a bounce to a higher high would be even more bullish, but not necessary for a continued market advance.
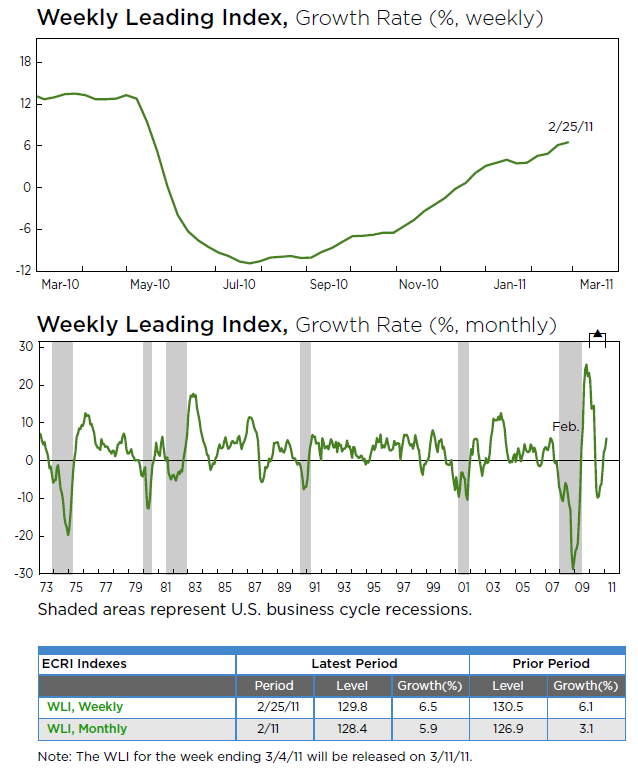
Chart of WLI from 1973 to 2011

How to play ECRI's Signals: I own a lot of small cap stocks in my personal "explore portfolio" so I own SPY to get a more market weighting in this trading portfolio. If I wanted to recommend just one ETF to be long the market and take advantage of ECRI's outlook for an upturn in the business cycle, it would be the Total Stock Market Index (VTI Charts and quote), which has BOTH large and small cap stocks. I also own the total stock market index fund at Vanguard, (VTSMX) as part of my personal core portfolios. Vanguard discourages trading its index funds so VTI is the vehicle of choice for that.
Notes:

  1. Occasionally the WLI level and growth rate can move in different directions, because the latter is derived from a four-week moving average.
  2. ECRI uses the WLI level and WLI growth rate to HELP predict turns in the business cycle and growth rate cycle respectively. Those target cycles are not the same as GDP level or growth, but rather a set of coincident indicators (including production, employment income and sales) that make up the coincident index. Based on two additional decades of data not available to the general public, there are a couple of occasions (in 1951 and 1966) when WLI growth fell well below negative ten, but no recessions resulted (although there were clear growth slowdowns).
  3. For a better understanding of ECRI's indicators, read its book, "Beating the Business Cycle."

KEY ECRI Articles:


Lakshman Achuthan - Beating the Business Cycle

“This easy-to-read book tells you how the respected ECRI calls turning points, and how you can, too.”
—Jane Bryant Quinn, Newsweek columnist

" The Economic Cycle Research Institute can justify a certain smugness now that business cycles are back in fashion."
--Harvard Business Review

“Shows... how far the state of the art in cycle forecasting has advanced, and how investors can profit from it.”
—Jon Markman, award-winning CNBC/MSN financial columnist 

Friday, January 21, 2011

ECRI's WLI Back to 36 Week High

The Economic Cycle Research Institute, ECRI - a New York-based independent forecasting group, released their latest readings for their proprietary Weekly Leading Index (WLI) this morning. (More about ECRI) 
For the week ending January 14, 2011
  • WLI  is 128.9 up from the prior week's reading of 128.1 and equal to the reading for the week ending December 24, 2010.  These are the highest readings since 36 weeks ago  on May 7, 2010 when WLI was at 131.9.
  • The lowest reading for WLI on record was 105.3 for the week ending March 6, 2009.
  • Last week's ECRI WLI Update for January 14, 2011
  • Since apparently bottoming at -10.3 for the week of August 27,  WLI growth moved higher or was flat for the 21st consecutive week to plus 3.1% from plus 3.6% a week ago.  
  • WLI growth of 4.1% is a 34-week high.
  • The last time WLI growth was higher was the reading for the week ending May 21, 2010 when it stood at positive 4.9%. 
  • My Portfolios at All Time Highs as we Enter 2011
On November 30, 2010 we reported in "ECRI Calls for Revival of US Economic Growth" that ECRI said "with a lot of conviction, that there is a revival in growth right ahead of us."  Since then, the economic data continues to slowly improve.
Commenting on the January 14th release, ECRI's Co-Founder, Chief Operations Officer and author of "Beating the Business Cycle", Lakshman Achuthan said: " With WLI growth rising for ten straight weeks to a 33-week high, U.S. economic growth will soon begin to revive."
Chart of WLI and WLI growth vs GDP Growth   
click to view full size charts
Since ECRI releases their WLI numbers for the prior week and the stock market is known in real time, you can sometimes get a clue for next week's WLI from the weekly change in the stock market. Notably, in the lead-up to the last two recessions, the WLI turned down months before the stock market did.
Chart of S&P500 vs ECRI's WLI
I want to point out that a correction in the stock market now would not necessarily change ECRI's call for an economic growth rate revival.  It takes a "pervasive" (for the majority) change of direction of their indicators in a "pronounced and persistent" way for ECRI to call for a turn in the economic cycle. These indicators and the trigger levels are proprietary.  I have found no one who has duplicated them or ECRI's success in calling business cycle turns based on their reading of their indicators.
Note that the chart above of the S&P500 vs. WLI shows a breakout above the dashed blue line that represents the neckline for a "Head and Shoulders Bottom" pattern.  This is a very bullish development.  A correction to test the pattern from above with a bounce to a higher high would be even more bullish, but not necessary for a continued market advance.
Chart of WLI from 1973 to 2010
Chart courtesy of ECRI
Notes: 
  1. The WLI for the week ending 1/21/11 will be released on 1/28/11
  2. Occasionally the WLI level and growth rate can move in different directions, because the latter is derived from a four-week moving average.
  3. ECRI uses the WLI level and WLI growth rate to HELP predict turns in the business cycle and growth rate cycle respectively. Those target cycles are not the same as GDP level or growth, but rather a set of coincident indicators (including production, employment income and sales) that make up the coincident index. Based on two additional decades of data not available to the general public, there are a couple of occasions (in 1951 and 1966) when WLI growth fell well below negative ten, but no recessions resulted (although there were clear growth slowdowns).  
  4. For a better understanding of ECRI's indicators, read their book, Beating the Business Cycle.
My take on ECRI's indicators, WLI and FIG plus how they relate to investments is included in "Kirk Lindstrom's Investment Letter."  FREE SAMPLE

Since 12/31/98 "Kirk's Newsletter Explore Portfolio" is UP 212%  vs. the S&P500 UP only 25% vs. NASDAQ  UP a only 22%   (All through 12/31/10) 
In 2009, "Kirk's Newsletter Explore Portfolio" gained 33.5% vs. the DJIA up 1.8%

In 2010 my "Explore Portfolio" gained 20.5%!!
vs. the DJIA up 13.8%
(the explore portfolio has 70% in equities and 30% in fixed income so the stocks are doing very, very well)


KEY ECRI Articles:

Lakshman Achuthan - Beating the Business Cycle

“This easy-to-read book tells you how the respected ECRI calls turning points, and how you can, too.”
—Jane Bryant Quinn, Newsweek columnist

" The Economic Cycle Research Institute can justify a certain smugness now that business cycles are back in fashion."
--Harvard Business Review

“Shows... how far the state of the art in cycle forecasting has advanced, and how investors can profit from it.”
—Jon Markman, award-winning CNBC/MSN financial columnist 


Friday, January 14, 2011

ECRI WLI Indicates US Growth To Revive Soon

The Economic Cycle Research Institute, ECRI - a New York-based independent forecasting group, released their latest readings for their proprietary Weekly Leading Index (WLI) this morning. (More about ECRI) 
For the week ending January 7, 2011
  • WLI  is 128.1 down from the prior week's reading of 128.9 and equal to the reading for the week ending December 17, 2010
  • The lowest reading for WLI on record was 105.3 for the week ending March 6, 2009.
  • Since apparently bottoming at -10.3 for the week of August 27,  WLI growth moved higher or was flat for the 20th consecutive week to plus 3.7% from plus 3.3% a week ago.  
  • WLI growth of 3.7% is a 33-week high.
  • The last time WLI growth was higher was the reading for the week ending May 21, 2010 when it stood at positive 4.9%. 
  • My Portfolios at All Time Highs as we Enter 2011
On November 30, 2010 we reported in "ECRI Calls for Revival of US Economic Growth" that ECRI said "with a lot of conviction, that there is a revival in growth right ahead of us."  Since then, the economic data continues to slowly improve.
Commenting on this data release, ECRI's Co-Founder, Chief Operations Officer and author of "Beating the Business Cycle", Lakshman Achuthan said: " With WLI growth rising for ten straight weeks to a 33-week high, U.S. economic growth will soon begin to revive."
Chart of WLI and WLI growth vs GDP Growth   
click to view full size charts
Since ECRI releases their WLI numbers for the prior week and the stock market is known in real time, you can sometimes get a clue for next week's WLI from the weekly change in the stock market. Notably, in the lead-up to the last two recessions, the WLI turned down months before the stock market did.
Chart of S&P500 vs ECRI's WLI
I want to point out that a correction in the stock market now would not necessarily change ECRI's call for an economic growth rate revival.  It takes a "pervasive" (for the majority) change of direction of their indicators in a "pronounced and persistent" way for ECRI to call for a turn in the economic cycle. These indicators and the trigger levels are proprietary.  I have found no one who has duplicated them or ECRI's success in calling business cycle turns based on their reading of their indicators.
Note that the chart above of the S&P500 vs. WLI shows a breakout above the dashed blue line that represents the neckline for a "Head and Shoulders Bottom" pattern.  This is a very bullish development.  A correction to test the pattern from above with a bounce to a higher high would be even more bullish, but not necessary for a continued market advance.
Chart of WLI from 1973 to 2010
 
Chart courtesy of ECRI

Notes: 
  1. The WLI for the week ending 1/14/11 will be released on 1/21/11
  2. Occasionally the WLI level and growth rate can move in different directions, because the latter is derived from a four-week moving average.
  3. ECRI uses the WLI level and WLI growth rate to HELP predict turns in the business cycle and growth rate cycle respectively. Those target cycles are not the same as GDP level or growth, but rather a set of coincident indicators (including production, employment income and sales) that make up the coincident index. Based on two additional decades of data not available to the general public, there are a couple of occasions (in 1951 and 1966) when WLI growth fell well below negative ten, but no recessions resulted (although there were clear growth slowdowns).  
  4. For a better understanding of ECRI's indicators, read their book, Beating the Business Cycle.
My take on ECRI's indicators, WLI and FIG plus how they relate to investments is included in "Kirk Lindstrom's Investment Letter."  FREE SAMPLE

Since 12/31/98 "Kirk's Newsletter Explore Portfolio" is UP 212%  vs. the S&P500 UP only 25% vs. NASDAQ  UP a only 22%   (All through 12/31/10) 
In 2009, "Kirk's Newsletter Explore Portfolio" gained 33.5% vs. the DJIA up 1.8%

In 2010 YTD my "Explore Portfolio" gained 20.4%!!
vs. the DJIA up 13.8%
(the explore portfolio has 70% in equities and 30% in fixed income so the stocks are doing very, very well)
(Subscribe Now - FREE Sample Issue - More Info - Return Data )

KEY ECRI Articles:
 
Lakshman Achuthan 
Beating the Business Cycle

“This easy-to-read book tells you how the respected ECRI calls turning points, and how you can, too.”
—Jane Bryant Quinn, Newsweek columnist

" The Economic Cycle Research Institute can justify a certain smugness now that business cycles are back in fashion."
--Harvard Business Review

“Shows... how far the state of the art in cycle forecasting has advanced, and how investors can profit from it.”
—Jon Markman, award-winning CNBC/MSN financial columnist 


Friday, January 07, 2011

ECRI's WLI Ends 2010 on a High Note

The Economic Cycle Research Institute, ECRI - a New York-based independent forecasting group, released their latest readings for their proprietary Weekly Leading Index (WLI) this morning. (More about ECRI) 
For the week ending December 31, 2010
  • WLI  is 128.9 down a tick from the prior week's reading of 129.0.   The last time WLI was higher was the reading for the week of May 7, 2010 when it stood at 131.9.
  • The lowest reading for WLI this year was 120.4 for the week ending July 16.
  • Since apparently bottoming at -10.3 for the week of August 27,  WLI growth moved higher or was flat for the 19th consecutive week to plus 3.3% from plus 2.3% a week ago.  
  • The last time WLI growth was higher was the reading for the week ending May 21, 2010 when it stood at positive 4.9%. 
  • My Portfolios at All Time Highs as we Enter 2011
On November 30 we reported in "ECRI Calls for Revival of US Economic Growth" that ECRI said "with a lot of conviction, that there is a revival in growth right ahead of us."  Since then, the economic data continues to slowly improve.

Chart of WLI and WLI growth vs GDP Growth   
click to view full size charts
Since ECRI releases their WLI numbers for the prior week and the stock market is known in real time, you can sometimes get a clue for next week's WLI from the weekly change in the stock market. Notably, in the lead-up to the last two recessions, the WLI turned down months before the stock market did.
Chart of S&P500 vs ECRI's WLI
I want to point out that a correction in the stock market now would not necessarily change ECRI's call for an economic growth rate revival.  It takes a "pervasive" (for the majority) change of direction of their indicators in a "pronounced and persistent" way for ECRI to call for a turn in the economic cycle. These indicators and the trigger levels are proprietary.  I have found no one who has duplicated them or ECRI's success in calling business cycle turns based on their reading of their indicators.
Note that the chart above of the S&P500 vs. WLI shows a breakout above the dashed blue line that represents the neckline for a "Head and Shoulders Bottom" pattern.  This is a very bullish development.  A correction to test the pattern from above with a bounce to a higher high would be even more bullish, but not necessary for a continued market advance.
Chart of WLI from 1973 to 2010
 Chart courtesy of ECRI
Notes: 
  1. The WLI for the week ending 1/7/11 will be released on 1/14/11
  2. Occasionally the WLI level and growth rate can move in different directions, because the latter is derived from a four-week moving average.
  3. ECRI uses the WLI level and WLI growth rate to HELP predict turns in the business cycle and growth rate cycle respectively. Those target cycles are not the same as GDP level or growth, but rather a set of coincident indicators (including production, employment income and sales) that make up the coincident index. Based on two additional decades of data not available to the general public, there are a couple of occasions (in 1951 and 1966) when WLI growth fell well below negative ten, but no recessions resulted (although there were clear growth slowdowns).  
  4. For a better understanding of ECRI's indicators, read their book, Beating the Business Cycle.
My take on ECRI's indicators, WLI and FIG plus how they relate to investments is included in "Kirk Lindstrom's Investment Letter."  FREE SAMPLE

Since 12/31/98 "Kirk's Newsletter Explore Portfolio" is UP 212%  vs. the S&P500 UP only 25% vs. NASDAQ  UP a only 22%   (All through 12/31/10) 
In 2009, "Kirk's Newsletter Explore Portfolio" gained 33.5% vs. the DJIA up 1.8%

In 2010 YTD my "Explore Portfolio" gained 20.4%!!
vs. the DJIA up 13.8%
(the explore portfolio has 70% in equities and 30% in fixed income so the stocks are doing very, very well)

Followers - Click "follow" to get an email alert for new articles

Kirk Lindstrom's Investment Letter Performance