Don't Miss Out On Great Gains! - Best Investment Newsletter


Click for FREE sample of Kirk Lindstrom's Investment Letter

Don't miss out! Subscribe Now

google.com, pub-7001134751860982, DIRECT, f08c47fec0942fa0

Search For More

Showing posts with label GDP. Show all posts

Thursday, April 27, 2017

Final Fed Estimate of Q1-2017 GDP Fell to Only 0.2%

President Trump will not be very happy if the Atlanta Fed's final estimate for the first quarter of US GDP under his watch is correct.

Today the Atlanta Fed announced its last estimate for Q1-2017 GDP before it switches to estimating GDP for Q2-2017 on May 1, 2017 (next Monday).

Latest forecast: 0.2 percent — April 27, 2017 


  • The final GDPNow model forecast for real GDP growth (seasonally adjusted annual rate) in the first quarter of 2017 is 0.2 percent on April 27, down from 0.5 percent on April 18. 
  • The forecast of first-quarter real consumer spending growth fell from 0.3 percent to 0.1 percent after yesterday's annual retail trade revision by the U.S. Census Bureau. 
  • The forecast of the contribution of inventory investment to first-quarter growth declined from -0.76 percentage points to -1.11 percentage points after this morning's advance reports on durable manufacturing and wholesale and retail inventories from the Census Bureau. 
  • The forecast of real equipment investment growth increased from 5.5 percent to 6.6 percent after the durable manufacturing report and the incorporation of previously published data on light truck sales to businesses from the U.S. Bureau of Economic Analysis.


As you can see from the chart:

  • The Atlanta Fed's estimate was over 3% in early February but has plunged towards zero since then.
  • The "Blue Chip consensus" has estimates for Q1-2017 GDP in the range of 0.9% to 2.1%
The Bureau of Economic Analysis, BEA, will release their first official estimate of Q1 GDP tomorrow, April 28, 2017. (Schedule)

Kirk Lindstrom's Investment Letter:
Subscribe NOW & get the
April 2017 Issue for FREE!

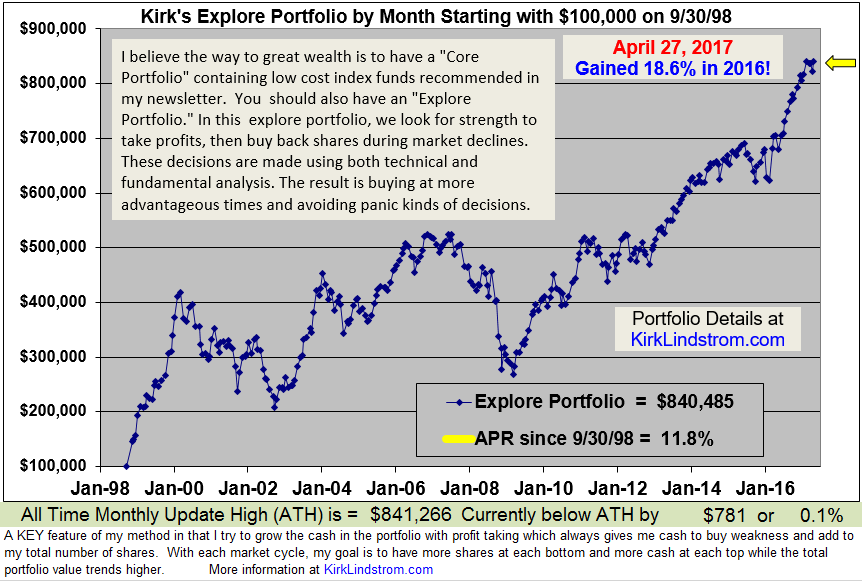
My Core and Explore Performance vs Warren Buffett's BRKA:

Tuesday, April 30, 2013

Q1 GDP & ECRI Clarification on Recession Call

On April 26, 2013, US Bureau of Economic Analysis released its first estimate of real gross domestic product, GDP.
Real gross domestic product -- the output of goods and services produced by labor and property located in the United States -- increased at an annual rate of 2.5 percent in the first quarter of 2013 (that is, from the fourth quarter to the first quarter), according to the "advance" estimate released by the Bureau of Economic Analysis. In the fourth quarter, real GDP increased 0.4 percent. 
The Bureau emphasized that the first-quarter advance estimate released today is based on source data that are incomplete or subject to further revision by the source agency (see the box on page 3 and "Comparisons of Revisions to GDP" on page 5). The "second" estimate for the first quarter, based on more complete data, will be released on May 30, 2013. 
The increase in real GDP in the first quarter primarily reflected positive contributions from
personal consumption expenditures (PCE), private inventory investment, exports, residential investment, and nonresidential fixed investment that were partly offset by negative contributions from federal government spending and state and local government spending. Imports, which are a subtraction in the calculation of GDP, increased.
We had a good discussion of this release in my "Investing for the Long Term" Facebook group where many questioned how could ECRI think we are in a recession with 2.5% GDP growth.

 Lakshman Achuthan from ECRI posted the following comments:  (Text follows image)

Text for my articles


Lakshman Achuthan You're not alone in thinking our recession call was wrong. Still, the facts are that the GDP release on August 28, 2008 – with the economy eight months inside the Great Recession – revised Q2/08 GDP growth to 3.3% from 1.9%, up from 0.9% in Q1/08. But both of those data points, as well as GDP data for the first two quarters of the 2001 and 1990-91 recessions, were subsequently revised by 2 to 4 percentage points over time. This is how real-time data often behave during recessions.

Lakshman Achuthan Hardly any economists recognized the severe 1973-75 recession until almost a year after it started. Indeed, that recession began with the ISM at 68.1, and payroll jobs growth did not turn negative for eight months.

In 1970, unaware that the economy was nine months into recession, none other than Paul Samuelson said that the NBER had worked itself out of a job, meaning that improved policy expertise had made recessions very unlikely. http://www.businesscycle.com/ecri-news-events/news-details/economic-cycle-research-the-2012-recession-are-we-there-yet


www.businesscycle.com
Nine months ago we knew that, sitting here today, most people probably would not realize that we are in recession – and we do believe we are in recession.

Lakshman Achuthan Just to clarify, a recession is not defined by two successive quarters of negative GDP, rather it's a self-reinforcing downturn in economic activity, when a drop in spending leads to cutbacks in production and thus jobs, triggering a loss of income that spreads across the country and from industry to industry, hurting sales and in turn feeding back into a further drop in production - in effect a vicious cycle. 
http://money.cnn.com/2008/05/05/news/economy/recession/


money.cnn.com
Recession? Or just a slowdown? Some will tell you it doesn't much matter - that it's a distinction without a difference. Nothing could be further from the truth - or as dangerous a delusion.


Thursday, May 31, 2012

2nd Estimate of Q2 2012 GDP Revised Lower

Excerpt from my next newsletter that I am working on this morning:
On May 31, the Bureau of Economic Analysis said their second estimate of Q1-2012 GDP (Gross Domestic Product adjusted for inflation) growth increased at an annual rate of 1.9%. This was a downward revision of 0.3% from April's estimate of 2.2%.  The estimates for prior quarters were unchanged.  

The increase in real GDP in the first quarter primarily reflected positive contributions from personal consumption expenditures (PCE), exports, residential fixed investment, private inventory investment, and nonresidential fixed investment that were partly offset by negative contributions from federal government spending and state and local government spending.  Imports, which are a subtraction in the calculation of GDP, increased.
You can read the full press release at  Gross Domestic Product, 1st quarter 2012 (second estimate)
How bad would this be if we actually had a balanced budget today?
See my articles:

Friday, February 26, 2010

2009 GDP Quarterly and Annual Data

Today the Bureau of Economic Analysis released its second estimate of US Gross Domestic Product or GDP for 2009 and Q4 of 2009. Unedited Press Release. The estimate for GDP was revised up by 0.2% from the first estimate for Q4-2009 GDP which was was 5.7%

See tables and graphs at the end of this article.

Highlights of Table 1:
  • The contribution from durable goods jumped 20.4% in Q3 from "Cash for Clunkers" then it dropped back to 0.2% in Q4.

  • Contribution to GDP from "Structures" continues to plunge at double digit rates.

GDP for 2009 by Quarter and Full Year
Q1-2009 = -6.4%
Q2-2009 = -0.7%
Q3-2009 = +2.2%
Q4-2009 = +5.9%

All of 2009 = -2.4%
All of 2008 = +0.4%

GDP: Fourth Quarter 2009 (Second Estimate)

  • Real gross domestic product -- the output of goods and services produced by labor and property located in the United States -- increased at an annual rate of 5.9 percent in the fourth quarter of 2009 (that is, from the third quarter to the fourth quarter) according to the "second" estimate released by the Bureau of Economic Analysis. In the third quarter, real GDP increased 2.2 percent.
  • The GDP estimates released today are based on more complete source data than were available for the "advance" estimate issued last month. In the advance estimate, the increase in real GDP was 5.7 percent (see "Revisions" on page 3).
  • The increase in real GDP in the fourth quarter primarily reflected positive contributions from private inventory investment, exports, personal consumption expenditures (PCE), and nonresidential fixed investment. Imports, which are a subtraction in the calculation of GDP, increased.
  • The acceleration in real GDP in the fourth quarter primarily reflected an acceleration in private inventory investment, an upturn in nonresidential fixed investment, a deceleration in imports, and an acceleration in exports that were partly offset by decelerations in PCE and in federal government spending.
  • Motor vehicle output added 0.44 percentage point to the fourth-quarter change in real GDP after adding 1.45 percentage points to the third-quarter change. Final sales of computers subtracted 0.01 percentage point from the fourth-quarter change in real GDP after subtracting 0.08 percentage point from the third-quarter change.

Gross domestic purchases

Real gross domestic purchases -- purchases by U.S. residents of goods and services wherever produced -- increased 5.5 percent in the fourth quarter, compared with an increase of 3.0 percent in the third.

Current-dollar GDP
_____________________________________Advance Second
Real GDP............................. 5.7 5.9
Current-dollar GDP................... 6.4 6.3
Gross domestic purchases price index. 2.1 1.9
(Percent change from preceding quarter)


2009 GDP
  • Real GDP decreased 2.4 percent in 2009 (that is, from the 2008 annual level to the 2009 annual level), in contrast to an increase of 0.4 percent in 2008.
  • The decrease in real GDP in 2009 primarily reflected negative contributions from nonresidential fixed investment, exports, private inventory investment, residential fixed investment, and personal consumption expenditures (PCE), that were partly offset by a positive contribution from federal government spending. Imports, which are a subtraction in the calculation of GDP, decreased.
  • The downturn in real GDP primarily reflected downturns in nonresidential fixed investment and in exports and a larger decrease in private inventory investment that were partly offset by a larger decrease in imports and a smaller decrease in residential fixed investment.
  • The price index for gross domestic purchases was unchanged in 2009, compared with an increase of 3.2 percent in 2008.
  • Current-dollar GDP decreased 1.3 percent, or $183.2 billion, in 2009. Current-dollar GDP increased 2.6 percent, or $363.8 billion, in 2008.
  • During 2009 (that is, measured from the fourth quarter of 2008 to the fourth quarter 2009), real GDP increased 0.1 percent. Real GDP decreased 1.9 percent during 2008. The price index for gross domestic purchases increased 0.6 percent during 2009, compared with an increase of 1.9 percent during 2008.

Percent Change From Preceding Period in Real Gross Domestic Product

Table 1: 2009 Data
[Percent] Seasonally adjusted at annual rates 2009
I
2009
II
2009
III
2009
IV
Gross domestic product-6.4-0.72.25.9
Personal consumption expenditures0.6-0.92.81.7
Goods2.5-3.17.22.8
Durable goods3.9-5.620.40.2
Nondurable goods1.9-1.91.54.1
Services-0.30.20.81.2
Gross private domestic investment-50.5-23.75.048.9
Fixed investment-39.0-12.5-1.36.2
Nonresidential-39.2-9.6-5.96.5
Structures-43.6-17.3-18.4-13.9
Equipment and software-36.4-4.91.518.2
Residential-38.2-23.318.95.0
Change in private inventories------------
Net exports of goods and services------------
Exports-29.9-4.117.822.4
Goods-36.9-6.324.634.2
Services-13.60.15.61.4
Imports-36.4-14.721.315.3
Goods-41.0-16.525.120.2
Services-11.5-7.57.0-3.9
Government consumption expenditures
and gross investment
-2.66.72.6-1.2
Federal-4.311.48.00.1
National defense-5.114.08.4-3.5
Nondefense-2.56.17.08.3
State and local-1.53.9-0.6-2.0

The above table breaking down the data by component is very interesting.
  • You can see the 20.4% Q3 jump in durable goods from "Cash for Clunkers" then it dropped back to 0.2% in Q4.

  • Contribution to GDP from "Structures" continues to plunge at double digit rates.

GDP Total and Percent 2000 to 2010

click image to view full size


US Federal Debt as a percentage of GDP

Next Release Date March 26, 2010

Followers - Click "follow" to get an email alert for new articles

Kirk Lindstrom's Investment Letter Performance