Don't Miss Out On Great Gains! - Best Investment Newsletter


Click for FREE sample of Kirk Lindstrom's Investment Letter

Don't miss out! Subscribe Now

google.com, pub-7001134751860982, DIRECT, f08c47fec0942fa0

Search For More

Thursday, September 30, 2010

John Paulson Market Outlook

Paulson Says Sell Bonds then Buy Homes and Stocks because double digit inflation is on the way.
John Paulson, the multibillionaire hedge fund operator who correctly called and profited from the collapse of the real estate bubble by shorting subprime mortgage debt, expects double digit inflation by 2012.  His advice is to sell bonds and buy stocks, gold (Gold Quote and Charts) and real estate.  Reports from all over the net including Forbes include these excerpts:
  • Paulson  likes equities with earnings yields of 7%-8% compared to the  2.6% pittance available on 10-year Treasuries. 
  • Favorite blue-chip stocks; JNJ (Johnson& Johnson) at a 3.8% yield; KO(Coca Cola);PFE, 4% yield., as well as C (Citigroup Charts & Quote), BAC (BankofAmerica)  and STI (Suntrust Banks)  and RF (Regions Financial).
  • Recommends distressed bonds of bankrupt companies, and then converting  the debt to equity in reorganization and benefiting  from the potential run up. He mentioned one of his greatest plays — K-Mart, which emerged from bankruptcy at $10 a share and then skyrocketed to $190 a share.
  • His crystal ball is for 2% GDP growth for 2011 and 2012 and he warns that the Fed’s promise of quantitative easing should contribute to double-digit inflation over the next few years.
  • As this is the best time in 50 years to buy homes, Paulson advised his listeners, crowded into 3 separate dining rooms, to issue 30 year mortgages to buy a home as “your debt and interest payments get locked in at record lows, while the price of your home will rise.”
  • If you don’t own a home buy one,” Paulson recommended; ” if you  own one home, buy another one, and if you own two homes buy a third and lend your relatives the money to buy a home.
Paulson has his money where his mouth is.  As of the end of Q2, he was the largest institutional holder of the Gold ETF GLD with a total position greater than the sum of the next three positions ( two through four.)
SPDR Gold Trust (GLD Charts and Current Quote
Owner Name
Date Shares Held Value
($1000)
PAULSON & CO INC 6/30/2010 31,500,000 $4,030,425
NORTHERN TRUST CORP 6/30/2010 11,638,263 $1,489,116
BANK OF AMERICA CORP... 6/30/2010 8,917,351 $1,140,975
MORGAN STANLEY 6/30/2010 8,485,486 $1,085,718
BLACKROCK ADVISOR 6/30/2010 6,876,673   $879,870

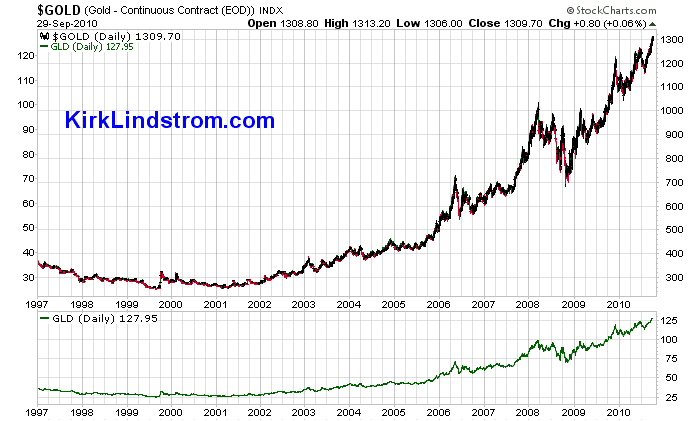
Gold has soared in the past two months to new all time highs.


More Information:

Monday, September 27, 2010

David Tepper Bullish

David Tepper, president & founder of Appaloosa Management, says the downside is relatively small while the potential upside is large for the US stock markets.

Video:

Airtime: Fri. Sept. 24 2010 | 5:15 AM ET
Runtime: 17 minutes

Summary:

Traders need economy to get going again.

No big deal if FED has to do QE for awhile.

Does not see a Japanese type scenario. Low rates save people on mortgages so they have more to spend on "stuff."

"We are not THAT big in financials" About 10% of the portfolio.

"I think the market will go up someway in the near term."

Long-term. Multiple for the S&P500 between 12 and 14. Currently the multiple is low.

Either the economy will get better or it won't then the FED will come in and make it better.

Becky Quick: "Does it make you nervous to be looking right and left and nobody else is following (what you are doing in the market such as buying in March 2009)"

Tepper: "I don't give a shit Sue."

Tepper thinks the market can go lower, perhaps 1,100. He will increase equities to 90 to 100% if it gets down to 1,000.

Doesn't worry about "backward" looking data. Likes to concentrate on where we are going. Thinks the economy is improving slowly and the question is when it will accelerate.

Comments on Carried Interest Tax: "I don't have a long run problem with carried interest tax." He said he would "adjust" if taxed more, would not leave the country, change what he is doing, etc.... but he said he needs time to make plans so he hopes they eventually get around to settling the issue.


Appaloosa Management
$12.4B under management

Friday, September 24, 2010

ECRI's WLI Growth Rate Up - Premature to Predict New Recession

ECRI's WLI Down but WLI Growth Rate Continues Higher
The Economic Cycle Research Institute, ECRI - a New York-based independent forecasting group, released their latest readings for their proprietary Weekly Leading Index (WLI) this morning. (More about ECRI)
For the week ending September 17, 2010
  • WLI  is 122.2, down from the prior week's reading of 122.6.  
  • The lowest reading for WLI this year was 120.4 for the week ending July 16.
  • WLI growth moved higher to minus 8.7% from a revised minus 9.3% a week ago.  
  • The last positive reading for WLI growth was for the week ending May 28, 2010 when it stood at positive 0.1%. 
Commenting on the data, Lakshman Achuthan, managing director at ECRI said, " After a brief plunge in the late spring, the WLI has been fairly stable throughout the summer and into September, suggesting that it is still premature to predict a new recession." 

Chart of WLI and WLI growth vs GDP Growth
Click to view full size chart
Since ECRI releases their WLI numbers for the prior week and the stock market is known in real time, you can often get a clue for next week's WLI from the weekly change in the stock market.
Chart of S&P500 vs ECRI's WLI
 
More Charts:
Notes: 
  1. The WLI for the week ending 9/24/10 will be released on 10/1/10.
  2. Occasionally the WLI level and growth rate can move in different directions, because the latter is derived from a four-week moving average.
  3. ECRI uses the WLI level and WLI growth rate to HELP predict turns in the business cycle and growth rate cycle respectively. Those target cycles are not the same as GDP level or growth, but rather a set of coincident indicators (including production, employment income and sales) that make up the coincident index. Based on two additional decades of data not available to the general public, there are a couple of occasions (in 1951 and 1966) when WLI growth fell well below negative ten, but no recessions resulted (although there were clear growth slowdowns).
Before you claim understanding of ECRI's WLI, make sure you read the article  "ECRI Weekly Leading Indicators Widely Misunderstood."
"Bottom line, neither the “experts” predicting that the sky is falling based on the WLI, nor the other “experts” indulging in misinformed WLI-bashing in an effort to discredit the super-bears, have a real clue to what the WLI is all about...  A slowdown in U.S. economic growth is imminent, but a new recession is not." 
Disclosure:  I am long the exchange traded fund for the S&P500, SPY charts and quote, in my personal account and in the "Explore Portfolio" in  "Kirk Lindstrom's Investment Letter."

Friday, September 17, 2010

Idea to Create Jobs

Background:  I read cash rich companies like Microsoft (MSFT Charts & Quote) and Cisco (CSCO charts and quote) are BORROWING BILLIONS of dollars to pay dividends and repurchase their stock because much of their cash is overseas.  If they bring the cash back to the US to hire workers here, pay dividends or buy back their own stock, then they are taxed so it is cheaper for them to borrow the money.

Idea #1:  Why not let companies bring their cash made overseas back to the US if used to grow employment here?  That is if they grow their workforce by $1B over 5 yrs (2,000 jobs that pay $100,000 salary over 5 yrs) then they can bring back $1B tax free.  If they reduce their US employment over that 5 yrs, then they have to repay the taxes due.

Idea #2: Even simpler, since dividends are taxed, why not let companies use overseas cash to increase their dividends?  This would be great for IRAs since the dividends would eventually be taxed as ordinary income when savers take the money out.... a good thing for the IRS.

This idea would make it MORE profitable to make money overseas from jobs created in the US.

Without this change, I fear companies like Microsoft, Cisco, Intel, HPQ, etc. (links go to stock quotes and charts)  will use the cash to buy companies outside the US to grow even more outside the US.  If tax policy here remains punishing to job creators, I believe they will eventually leave the US for more tax friendly countries like Verigy (VRGY quote and charts) did after it spun off from Agilent/HP and moved to Singapore.  

FWIW, moving jobs overseas for better tax treatment and lower wages is nothing new.  When I started at Hewlett-Packard as a summer intern in 1978 we were in the process of moving final test of some volume products to Singapore.  By the time I left 20 years later, I was training experienced engineers from Singapore (on temporary visas) to do jobs I trained top engineering graduates from CAL, Stanford and MIT to do ten years before.   It is no accident US jobs moved to where companies can operate at a higher profit.  The US needs to look at how it can reverse the tide and bring jobs back to the US.

What do you think?  Post your thoughts in the Comments Section.

Update 12:40 PM PST:    Details are in comments section:
  1.  Cisco has over $30 billion outside the U.S.  John Chambers said "Easiest way to generate jobs is to bring back the money, Implore people to do that. Of Fortune 100, we may be only one that is growing headcount in the U.S. by 10%."
  2. John Chambers said  repatriation of cash, if it occurs, some will be used for job creation, some to drive up stock prices (probably via buybacks.)  Even buybacks are good for the taxpayer as they will come back to be taxed  as ordinary income when people with stock in their IRAs convert it to cash to take RMDs when they retire.

ECRI WLI & Growth Rate Both Up Again

ECRI's WLI Up & WLI Growth Rate Ticks Up
The Economic Cycle Research Institute, ECRI - a New York-based independent forecasting group, released their latest readings for their proprietary Weekly Leading Index (WLI) this morning. (More about ECRI)
For the week ending September 10, 2010
  • WLI  is 122.6, up from the prior week's reading of 120.0.  
  • The lowest reading for WLI this year was 120.4 for the week ending July 16.
  • Ending an 8-week period of double digit negative growth, WLI growth moved higher to minus 9.2% from minus 10.1% a week ago.  
  • The last positive reading for WLI growth was for the week ending May 28, 2010 when it stood at positive 0.1%. 
Chart of WLI and WLI growth vs GDP Growth

Click to view full size chart
Since ECRI releases their WLI numbers for the prior week and the stock market is known in real time, you can often get a clue for next week's WLI from the weekly change in the stock market.
Chart of S&P500 vs ECRI's WLI
More Charts:
Notes: 
  1. The WLI for the week ending 9/17/10 will be released on 9/24/10.
  2. Occasionally the WLI level and growth rate can move in different directions, because the latter is derived from a four-week moving average.
  3. ECRI uses the WLI level and WLI growth rate to HELP predict turns in the business cycle and growth rate cycle respectively. Those target cycles are not the same as GDP level or growth, but rather a set of coincident indicators (including production, employment income and sales) that make up the coincident index. Based on two additional decades of data not available to the general public, there are a couple of occasions (in 1951 and 1966) when WLI growth fell well below negative ten, but no recessions resulted (although there were clear growth slowdowns).
Before you claim understanding of ECRI's WLI, make sure you read the article  "ECRI Weekly Leading Indicators Widely Misunderstood."
"Bottom line, neither the “experts” predicting that the sky is falling based on the WLI, nor the other “experts” indulging in misinformed WLI-bashing in an effort to discredit the super-bears, have a real clue to what the WLI is all about...  A slowdown in U.S. economic growth is imminent, but a new recession is not." 
Disclosure:  I am long the exchange traded fund for the S&P500, SPY charts and quote, in my personal account and in the "Explore Portfolio" in  "Kirk Lindstrom's Investment Letter."

Monday, September 13, 2010

Dow Gold Ratio - DJIA vs GLD

Dow Gold Ratio Approaching 20-Year Lows. With the price of gold ($1,246.00) just below its recent all time high,  the DOW:Gold ratio is approaching 20 year lows. 
At 8.40, the Dow Jones Industrial Average measured in how many ounces of gold it takes to buy the 30 stock DOW is up 19.5% from its 17-year March 6th, 2009 low of 7.03. 
Despite good gains for the DOW since March 2009, the DOW-Gold ratio remains  just above its  March low and 81% below its 1999 peak of 44.77.
Here is a chart showing the current Dow to Gold Ratio, the ratio of the price of the Dow Jones Industrial Average to the price of gold. When measured in ounces of Gold, the DOW has been in a secular bear market since peaking in late 1999 at nearly 45.
 (Click Charts for full size images)
Gold - Continuous Contract (EOD) ($GOLD) DAILY bars
Day   Date        Close
=== =========== ==========
Fri 10-Sep-2010 1246.2000
Thu 09-Sep-2010 1243.8000
Wed 08-Sep-2010 1255.1000
Tue 07-Sep-2010 1255.5000
Fri 03-Sep-2010 1247.0000
Thu 02-Sep-2010 1251.2000
...
Fri 18-Jun-2010 1256.6000 
The markets, measured by the S&P500 (S&P500 Charts) and DIJA (DJIA Charts), may have recovered to new highs in 2007, but the DOW:Gold ratio told a different, truer story of just how unhealthy the US economy was.
  • Back in 1999, it took nearly 45 ounces of gold to buy the DJIA.
  • On Friday March 6 of 2009 the DOW-Gold ratio hit a low of 7.03
  • As of Friday (September 10, 2010) it only takes 8.40 ounces of gold to buy the DOW
  • Gold quote and charts
All time Lows:

The DJIA-to-Gold ratio got down near 1 in the early 1980s and was just under 0.2 in the early 1800s.

This 200 Year Dow/Gold Chart shows the DOW/Gold ratio from 1800 through August 2008.
chart courtesy of www.sharelynx.com (Click for full size image)

With the DOW:Gold ratio now at 8.40, it is trading below the green zone in the second chart. The ratio is oversold, but nothing says it can't get more "oversold."

CDs have been a "safe haven" for those wishing to preserve assets and get a small inflation adjusted return. See "Very Best CD Rates with FDIC" for a list of the best rates and terms.  

The Top 10-year CD rate is 3.25% at Discover Bank which compares well with the 10-yr US Treasury with a current yield of 2.77%.  For more information, see:
Disclosure: I own a very small amount of gold hidden in the house for bribes if we see Armageddon. For income plus inflation protection, I own and recommend in my newsletters TIPS, TIPS mutual funds and Series iBonds.

For more information, see:
Question: Which way do you think the DOW-Gold ratio is headed?

Friday, September 10, 2010

ECRI WLI & Growth Rate Both Up

ECRI's WLI Up & WLI Growth Rate Ticks Up
The Economic Cycle Research Institute, ECRI - a New York-based independent forecasting group, released their latest readings for their proprietary Weekly Leading Index (WLI) this morning. (More about ECRI)
For the week ending September 3, 2010
  • WLI  is 122.0, up from the prior week's revised reading of 120.5.  
  • The lowest reading for WLI this year was 120.4 for the week ending July 16.
  • WLI growth moved higher to minus 10.1 percent from a revised minus 10.2 percent a week ago.  
  • The last positive reading for WLI growth was for the week ending May 28, 2010 when it stood at positive 0.1%. 
Chart of WLI and WLI growth vs GDP Growth
     
    Click to view full size chart
    Since ECRI releases their WLI numbers for the prior week and the stock market is known in real time, you can often get a clue for next week's WLI from the weekly change in the stock market.
    Chart of S&P500 vs ECRI's WLI
    Charts:
    Notes: 
    1. The WLI for the week ending 9/10/10 will be released on 9/17/10.
    2. Occasionally the WLI level and growth rate can move in different directions, because the latter is derived from a four-week moving average.
    3. ECRI uses the WLI level and WLI growth rate to HELP predict turns in the business cycle and growth rate cycle respectively. Those target cycles are not the same as GDP level or growth, but rather a set of coincident indicators (including production, employment income and sales) that make up the coincident index. Based on two additional decades of data not available to the general public, there are a couple of occasions (in 1951 and 1966) when WLI growth fell well below negative ten, but no recessions resulted (although there were clear growth slowdowns).
    Before you claim understanding of ECRI's WLI, make sure you read the article  "ECRI Weekly Leading Indicators Widely Misunderstood."
    "Bottom line, neither the “experts” predicting that the sky is falling based on the WLI, nor the other “experts” indulging in misinformed WLI-bashing in an effort to discredit the super-bears, have a real clue to what the WLI is all about...  A slowdown in U.S. economic growth is imminent, but a new recession is not." 
    Disclosure:  I am long the exchange traded fund for the S&P500, SPY charts and quote, in my personal account and in the "Explore Portfolio" in  "Kirk Lindstrom's Investment Letter."
    Date
    WLI WLI Growth
    Rate %
    28-May-10 123.7 0.1
    4-Jun-10 122.7 -3.8
    11-Jun-10 121.9 -6.0
    18-Jun-10 122.3 -7.4
    25-Jun-10 121.4 -8.4
    2-Jul-10 120.5 -9.3
    9-Jul-10 120.5 -9.9
    16-Jul-10 120.4 -10.7
    23-Jul-10 120.7 -11.0
    30-Jul-10 121.4 -10.7
    6-Aug-10 122.0 -10.2
    13-Aug-10 120.7 -10.0
    20-Aug-10 120.9 -9.9
    27-Aug-10 120.5 -10.2
    3-Sep-10 122.0 -10.1

    Tuesday, September 07, 2010

    FNSR: Analyst Summary for Finisar

    Finisar Corporation (NASDAQ: FNSR Charts), a global technology leader for subsystems and components for fiber optics communications, reported record results on Sept. 2. Jerry Rawls, Finisar's executive Chairman of the Board said "We achieved company records for revenues, gross margin, operating margin and EPS. Furthermore, the demand environment continued to be very strong for us, particularly for our higher data rate transceivers and our ROADM products. As a sign of that ongoing strength, our book-to-bill ratio in the quarter continued to be above 1.0."

    I've been a big fan of Finisar for some time. (See my March 3, 2009 BUY ALERT under "Figures.") I have made a lot of money from the stock and continue to hold shares as I trade its volatility around my core position for added return.  I recently added shares back to my explore portfolio at $12.50 that I sold earlier at $15.88.

    FNSR - Finisar Corporation
      Intraday Chart  10-Year Chart  

    This is some of what I wrote about Finisar in my recently published September issue of "Kirk Lindstrom's Investment Letter."
    8/18/10 Update: "Conservative growth estimates from Cisco, a big FNSR customer, caused the stock price to correct to the point I am tempted to buy shares I sold at $15.88 to take profits. I have not bought yet because the market overall is technically bearish with many failed support levels, including Finisar not holding the dashed green line. Thus, I am waiting for a fat pitch at the auto buy level of $12.50 which is 54¢ below the current 200-DMA at $13.04. Overall, I remain very bullish for Finisar with a 5.0% explore portfolio weighting at $14.04."
    and
    8/18/10 continued:  Unlike stocks tied more directly to the economy such as GE and FedEx, FNSR will grow even if economic growth slows to a trickle. All those iPads, iPods, and Android phones people are buying as fast as they are made will have users wanting more bandwidth to see videos, surf the web and have video chats. People now seem to be splurging on these new, cool “toys” while they put off buying new refrigerators, autos and other big-ticket items until they are sure they will keep their jobs. Especially when compared to its history, Finisar is remarkably “cheap” with a 0.9 PEG for current fiscal year earnings estimates.
    It was worth the wait.  On 8/24 I sent an email "FNSR Auto Buy Alert" to my subscribers
    Hello Subscribers , I just bought 125 shares of FNSR at $12.50 for the explore portfolio according to the "Auto Buy and Sell Table" on page 31 of the September newsletter I emailed yesterday.

    For some reason, my buy order in my IRA did not fill.  Maybe enough of you had orders in front of mine and they ran out of shares at $12.50.  The real goal is to add here below the 200-DMA (currently $13.16) after a 43% decline from the recent peak.  Thus, I changed my personal order and bought 150 shares for my IRA at $12.80 rather than bother worrying about $45 left on the table.  I remember paying about $50 in commission to buy stocks back in the 1990s! 
    One skilled subscriber wrote me on August 26 he bought within 2¢ of the ultimate bottom:
    "Picked up 100 FNSR yesterday at $12.00 even plus $7.95 with Fidelity.."
    Chart shows FNSR bottomed at $11.98, 52¢ below where I bought back my profit taking shares.  Note how it traded briefly below its 200 day moving average before returning to the dashed green support/resistance line.

    Lets see what other analysts have to say about Finisar.

    StreetInsider.com reports:
    Citi maintains a 'Hold' on Finisar Corp, raises PT from $17.50 to $19.  Citi analyst says, "Results and guidance underscore our view that telecom cap ex recovery intact and optical spend on the mend as telecom component revenue increased +28% q/q & ROADMs grew +13% (units +25%), more than offsetting 5% LAN/SAN sequential decline. Mgt stated that 2Q LAN/SAN likely flat, implying +6% - +14% growth in Telecom/ROADM."
    American Banking News reports:
    Credit Suisse boosted its price target on shares of Finisar  from $16.00 to $20.00 after strong first quarter results in a research note to investors on Friday. The analysts said that the company’s strong earnings indicates an ongoing rebound in demand. The analysts also maintained a “neutral” rating in a research note to investors on Friday.
     Benzinga reports:
    Jefferies Maintains Hold Rating On Finisar After Earnings.
    The Jefferies analysts wrote, "Finisar is expanding capacity as demand for ROADM and 10G continues to surprise to the upside. However, we remain cautious due to the potential for inventory build by Finisar's customers in response to higher lead times. Maintain Hold and $16 PT."
    Wall St. Cheat Sheet reports:
    In a nutshell, the borderline absurd increase in data traffic over traditional telecomm networks brought on by the advent of smartphones, etc., has stressed these networks to the point that they can no longer operate efficiently.  The obvious example of this would be the manner by which the iPhone has single-handedly made AT&T into a “terrible” wireless carrier.  In reality, it’s not so much that AT&T has a sub-par network as much as it is that those networks were built to accommodate telephone calls, not 15-minute youtube videos of your friends dog eating a sandwich.
    This is the predicament referred to as “wireless backhaul.”  We send a little bit of data to the network, i.e., dogeatssandwich.com, but the network must send back (thus “backhaul”) an exponentially greater amount of data, i.e., the 15-minute video.  The solution to this problem involves rehashing much of the existing network, and happens to be one of the few true high-growth domestic themes in existence.  All of the companies involved stand to benefit greatly, and FNSR may be at the forefront.

    ...  Nonetheless, FNSR is one of the higher-visibility growers out there, and would definitely make a solid pick for any portfolio.  Look for shares to test July highs at around $18 if the market can keep from falling too much.

    This is part of what I am preparing for the next issue of  "Kirk Lindstrom's Investment Letter."
    I believe Finisar is the best company in the fiber optics business and its products will be critical for the transmitting data long and short distances. Server farms will switch to optical links to move data between servers to save on energy compared to using wires; less energy means lower cooling costs too.
    ...On Sept 2 FNSR announced revenues grew 10.3% and 61.5% over Q4-2010 and Q1-2010 to a record of $207.9M. Net income (GAAP) was $19.4M or 19.1¢ per share and 11.4% of revenue.
    ...For Q2, FNSR expects revenue of $215M to $230M with net margin growing to 11.5% of revenue. 
    OK everyone, get back to sending friends and family Labor Day videos with your cell phones.


    and get the October 2010 Issue for FREE!!
    For details on both my newsletters, read

    Monday, September 06, 2010

    Open Gaps in S&P Futures

    Date: 05/03/10 O=1194.0 H=1196.8 L=1194.0 C=1194.1
    Date: 05/13/10 O=1159.5 H=1167.0 L=1151.3 C=1152.5
    Date: 08/10/10 O=1,115 H=1,124.5 L=1,108.5 C=1,119.7
    ==>Current:  as of Tuesday 9/10/10  1:13A CS 1,100.8<==
    Date: 08/31/10 O=1046.7 H=1052.5 L=1046.7 C=1052.5
    Date: 09/02/10 O=1088.8 H=1090.3 L=1088.8 C=1090.0


    Sunday, September 05, 2010

    Gartner Worldwide Semiconductor Revenue Latest Prediction & History

    01 Sept 2010 [Predicts $314B for 2011] Worldwide semiconductor revenue in 2010 is forecast to reach $300 billion, a 31.5 per cent increase from 2009 revenue of $228 billion, according to the latest outlook by Gartner, Inc. Analysts project worldwide semiconductor revenue to total $314 billion in 2011, a 4.6 per cent increase from 2010.
    (press Release) [2010 actual tbd]

    03 June 2010 [Predicts $307B for 2011] Worldwide chip revenue is forecast to reach $290 billion in 2010, a 27.1 percent increase from 2009 revenue of $228 billion, according to Gartner, Inc.  The outlook for the semiconductor industry has improved from Gartner's first quarter 2010 forecast, when it projected worldwide semiconductor sales to grow 19.9 percent.  Gartner analysts expect the semiconductor industry to show continued growth through its forecast period in 2014. The market is on track to surpass the $300 billion mark in 2011, when the market is forecast to total $307 billion.
    (Story at EE Times)  [2010 actual tbd]

    16 November 2009  [predicts $255B for 2010] Worldwide semiconductor revenue is on pace to total $226 billion in 2009, an 11.4 percent decline from 2008 revenue of $255 billion, according to the latest outlook by Gartner, Inc... Semiconductor revenue in 2010 is expected to bounce back to the same revenue level as 2008 at $255 billion, a 13 percent increase from 2009.
    (Press Release) [2010 actual tbd]

    26 August 2009 [Predicts $233B for 2010] Worldwide semiconductor revenue is on track to total $212 billion in 2009, a 17.1 percent decline from 2008 revenue of $255 billion, according to the latest outlook by Gartner, Inc. This forecast is better than the second quarter projections when Gartner projected semiconductor revenue to decline 22.4 percent this year. ... Gartner’s latest outlook for 2010 is worldwide semiconductor revenue to total $233 billion, a 10.3 percent increase from 2009 projections.

    (Press Release)  [2010 actual tbd]

    03 Sept 2008 [Predicts $308B for 2009]  Gartner said it now expects overall 2008 semiconductor revenue to be $285 billion, an increase of 4.2 percent over 2007. The firm had most recently projected chip revenue to be 4.6 percent for the year, reaching $287 billion. Gartner lowered its 2009 revenue projection to $308 billion, up 7.8 percent from 2008. The firm's earlier projection called for 2009 revenue to increase 7.9 percent to $309 billion.
    (Story at EE Times)  [2009 actual $218.5B]

    05 May 2007 [Predicts $293B for 2008 & $314B for 2009]  Gartner Inc. has lowered its 2007 worldwide semiconductor forecast to $269.2 billion, a 2.5 percent increase from 2006. In Gartner's previous forecast, it predicted a 2007 revenue increase of 6.4 percent.  Gartner expects the worldwide semiconductor industry to return to modest annual growth of 8.7 percent and 7.2 percent in 2008 and 2009, respectively.
    (Story at EE Times
    • 2008: 1.087x$269B = $293B
      [2008 actual $256.0B]
    • 2009: 1.072x$293B = $314B
      [2009 actual $218.5B]


    Year Worldwide Semiconductor Revenue  Worldwide Semiconductor Revenue  Yr/Yr Change

    x1,000 $B
    1990 $50,025,208 50.0
    1991 $54,449,772 54.4 8.8%
    1992 $59,016,977 59.0 8.4%
    1993 $75,654,012 75.7 28.2%
    1994 $99,168,072 99.2 31.1%
    1995 $140,689,092 140.7 41.9%
    1996 $134,176,361 134.2 (4.6%)
    1997 $136,826,119 136.8 2.0%
    1998 $125,679,501 125.7 (8.1%)
    1999 $144,986,258 145.0 15.4%
    2000 $200,550,000 200.6 38.3%
    2001 $147,560,000 147.6 (26.4%)
    2002 $138,330,000 138.3 (6.3%)
    2003 $161,970,000 161.9 17.1%
    2004 $210,320,000 210.3 29.9%
    2005 $225,540,000 225.5 7.2%
    2006 $246,020,000 246.0 9.1%
    2007 $255,470,000 255.5 3.8%
    2008 $255,990,000 256.0 0.2%
    2009 $218,480,000 218.5 (14.7%)
    2010 thur July $165,990,000


      Thursday, September 02, 2010

      Equity, Bond & Money Market Fund Flows - Yearly Totals

      Money continues to pour into bond funds and out of equities.  This is the fourth week in a row and seven of the last ten weeks that money flowed out of equity funds.  Annual data shown in table 1 below.
      Weekly 09/01/2010 
      • Equity Fund outflows $5Bil
      • Taxable Bond Fund Inflows $1Bil
      • xETFs - Equity Fund outflows $3.4 Bil
      • Taxable Bond Fund Inflows $0.442 Bil
      Fund Flow Totals for 2010 through 9/1/10
      Table 1 AMG Fund Flows for Full Year - $B
      Fund Flows for Equity Tax Bond MM Fund
      2003 40.8 40.7 NC
      2004 95.0 11.3 (64.3)
      2005 71.9 9.3 89.0
      2006 52.5 29.9 308.3
      2007 111.3 68.8 569.5
      2008 3.5 (3.3) 608.0
      2009 6.0 172.0 (280.2)
      2010 (28.6) 111.2 (377.5)
      • NC = Data Not Compiled
      •  += Some data points for Money Market Fund flows between March 2010 and July 14, 2010 are missing but the overall trend is clear. 
      • Raw data from AMG Weekly Fund Flows Data
      ExETFs—For the week ended 9/1/2010 all Equity funds report net outflows totaling $3.170 billion as Domestic Equity funds report net outflows of $3.164 billion and Non-Domestic Equity funds report net outflows of $0.006 billion...   ExETFs—Emerging Markets Equity funds report net inflows of $0.462 billion, the group’s thirteenth consecutive week of positive flows and the only regional group with net inflows... Net inflows are reported for All Taxable Bond funds (+$1.230 billion), bringing the rate of inflows of the $2.571-trillion sector to $3.469 billion/week...  International & Global Debt funds (+$0.787 billion) continued to draw assets as they reported inflows for the fourteenth consecutive week... Net inflows of $0.471 billion were reported for Corp-Investment Grade funds... Money Market funds report net inflows of $1.855 billion...  ExETFs—Municipal Bond funds report net inflows of $0.912 billion...

      10-YEAR TREASURY NOTE TNX (in %)


      Followers - Click "follow" to get an email alert for new articles

      Kirk Lindstrom's Investment Letter Performance