Don't Miss Out On Great Gains! - Best Investment Newsletter


Click for FREE sample of Kirk Lindstrom's Investment Letter

Don't miss out! Subscribe Now

google.com, pub-7001134751860982, DIRECT, f08c47fec0942fa0

Search For More

Wednesday, December 11, 2019

Tesla Skeptic Jim Cramer Has a Buy on Tesla Near the Top

Jim Cramer Has a Buy on Tesla now at $352.70!
"I'm now a zealous convert.  A true believer in Tesla.  That is why I can't commit in Netflix." followed by his BUY BUY BUY sound effect.
and
“Cult product? Check. Sound balance sheet? Check. Charismatic Leader? Check,” the host said. “If you’re going to invest in a battleground stock, Tesla’s got all the ingredients of a winner.”


He made a long case for why he now likes it including:
  • His daughter, who is not a car person, liked it for a drive from Portland, Oregon to SF California.
  • His wife says the solar roof panels are the same price as regular roof panels so she wants to get them. (I wonder if they have an expensive slate roof as I doubt they are as cheap as asbestos shingles or even my more expensive concrete tile roof.)

Cramer gets a lot of headlines but I believe it has been years since he's been able to beat just buying and holding an index fund for his recommended stocks.  

He had a great record as a hedge fund manager but he admitted in this video that he did some things that are not allowed... then or today.  Go to 2:20 to 3:40 where he admits to doing what was and is "blatantly illegal."

To me, that explains why he can't beat the markets without cheating these days... it is far different than market manipulation that he explains in the whole video such as calling reporters to spread news about Apple to move the stock!


  1. 6:10 Hit the brokerage houses with a series of orders that can push it down
  2. 6:15 Then leak it to the press
  3. 6:17 then get it on CNBC, that is also very important.

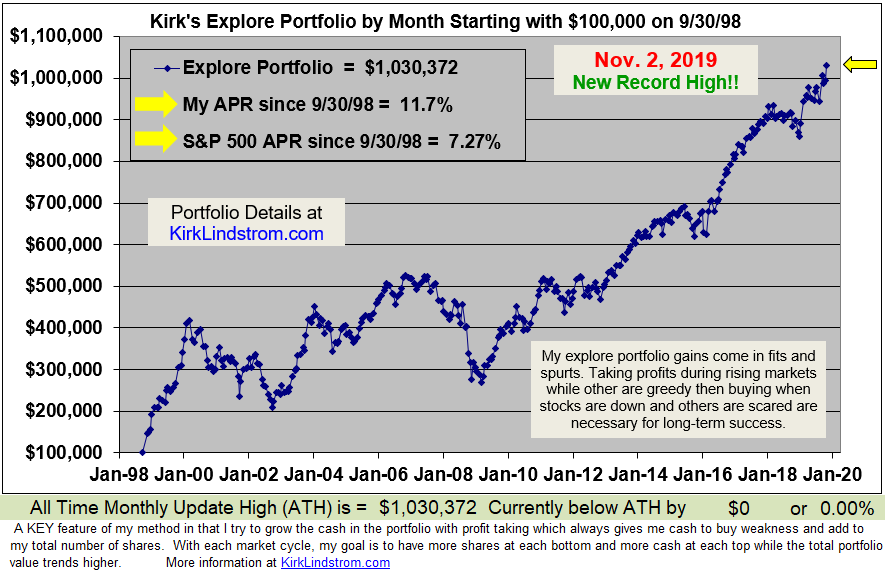
My performance without cheating.....
Kirk's Explore Stock Performance Estimate for 2019 YTD

Kirk Lindstrom's Investment Letter

Don't miss out!
Subscribe NOW and get the December 2019 Issue for FREE!


Saturday, November 02, 2019

Investor Sentiment Charts for November 2, 2019

The Stock market, as measured by the S&P 500 and the NASDAQ, is at a record high.  As you would expect, investor sentiment has recovered quite a bit from its recent lows with the short term "Fear and Greed Index" now in rated as "Extreme Greed."  Many of my longer-term sentiment charts remain well below excessive optimism.

Market Update for Friday Nov. 1, 2019
Fear and Greed Index
Fear and Greed Index vs S&P 500:


Investors Intelligence Bulls / (Bulls+Bears) vs S&P 500 Weekly Close

Put:Call Ratio:
DJIA vs Oscillators 

2CS-p

New Record High for My Explore Portfolio!   I've taken profits and now have my Explore Portfolio at WX% in Stocks and YZ% in Fixed Income.  Subscribe now to find out what I hold.


Kirk Lindstrom's Investment Letter
Don't miss out!


Thursday, October 10, 2019

Investor Sentiment Charts for October 10, 2019

The markets are just off record highs yet investor sentiment is quite bearish.  This is great news for contrarian investors.

This table shows the S&P 500 is only 2.9% below its record high,  the Russell 2000 small cap index is 14.7% off its record high while the Dow and Nasdaq markets are somewhere in between these two.
Market Data for 10/10/19
Market Comparison
Market Sentiment Charts for 10/10/19:

This CPC chart is one of my favorites for aiding me buy and sell around my core positions in addition to the limit orders I have for each stock in my newsletter.  That is I will add or subtract to positions and send out "Special Alert Emails" notifying my subscribers when this CPC and some of my other sentiment charts (not all published below) say it is time.


AAII Survey: Bulls minus Bears vs. Log DJIA


Dow vs proprietary "Oscillators" that also give me help knowing when to add or subtract from my Explore Portfolio positions.


TD: Timer Digest ST (1-yr) Bulls - Bears vs. S&P 500
10/10/19 Close


Once a month in my newsletter on page 6 I update one or more of my sentiment charts and discuss in more detail what they mean to me.  Send for a free sample to see what it looks like.


Kirk Lindstrom's Investment Letter
Don't miss out!
 Subscribe NOW

and get the October 2019 Issue For Free!


Thursday, September 12, 2019

Investor Sentiment Charts for September 11, 2019

Yesterday my Newsletter Explore Portfolio and my own personal portfolio closed at record highs.  
Market Data for 9/11/19
Market Update - Closing Statistics
Despite the markets being close to record highs, investor sentiment is not as bullish as one might think.  Below are some of the sentiment charts I follow.

The "pros" in the II graph are more bullish than individual investors in the AAII graph with the number of bullish individual investors back above the number of bullish investors.


II Bulls-Bears Sentiment Graph - Log Scale

AAII Survey: Bulls minus Bears vs. Log DJIA


Kirk Lindstrom's Investment Letter
Don't miss out!
 Subscribe NOW

and get the September 2019 Issue For Free!

TD: Timer Digest ST (1-yr) Bulls - Bears vs. S&P 500  

TD: Timer Digest Gold Bulls - Bears vs. GLD 

Put Call Ratio ($CPC)

TD Timer of the Year Race
(I'm tied for second for 2019!)


Let me know if you have any other favorite charts of mine you'd like to see on a regular basis.
Kirk Lindstrom's Investment Letter
Don't miss out!
 Subscribe NOW

and get the September 2019 Issue For Free!

Never Forget 9/11/01

Thursday, August 08, 2019

AAII Bulls Minus Bears vs DJIA Survey Data and Graphs for 8/8/19

The AAII Investor Sentiment Survey measures the percentage of individual investors who are bullish, bearish, and neutral on the stock market for the next six months.

As of 08/08/19, the AAII members are:
  • Bullish: 21.66%
  • Neutral: 30.15%
  • Bearish: 48.20%
Below are some of my charts showing this data over time.


Kirk Lindstrom's Investment Letter
Don't miss out!
 Subscribe NOW

and get the August 2019 Issue For Free!


Compare my results to SPY with Dividends reinvested:


More Information
  • Charts of the AAII (American Association of Individual Investors) Bulls minus Bears Index versus the market are key sentiment indicators for stock market technical analysis.  Contrarian theory states the time to buy is when fear and pessimism are at a maximum since this usually occurs near market bottoms. 
  • The AAII Investor Sentiment Survey measures the percentage of individual investors who are bullish, bearish, and neutral on the stock market for the next six months . AAII is the "American Association of Individual Investors." For the survey, Individual members of the AAII are polled on a weekly basis. Only one vote per member is accepted in each weekly voting period. The AAII reports the weekly results at https://www.aaii.com/sentimentsurvey/
  • A contrarian is a person with a preference for taking a position opposed to that of the majority view prevalent in the group of which they are a part of.

Friday, May 10, 2019

April Treasury Revenue up 4.9% while Spending Soars 7.6%

My table below shows a "Summary of Receipts, Outlays, and the Deficit/Surplus of the U.S. Government by Month Through April 2019."  

Monthly US Treasury Statement Calculations
  • A staggering 20.6 cents of ever dollar spent so far in fiscal 2019 came from new borrowing!
Year over year change  for April:
  • Monthly revenue (taxes, fees and tariffs) grew 4.9% over 2019
  • Monthly spending grew 7.6% vs 2019
  • The monthly deficit fell 25.2% vs 2019 
  • but year over year the total deficit grew 37.7%!!!
Summary of Receipts, Outlays, and the Deficit/Surplus of the U.S. Government by Month. [$ millions]

The Monthly Treasury Statement summarizes the financial activities of the federal government and off-budget federal entities and conforms to the Budget of the U.S. Government.

FULL Year Summary:


FULL Year Summary Stated as a Family Budget:


You can never have too much data so I process the latest reports to see tax collections, spending and the official deficit behaves without "noise" from the obviously biased MSM "Main Stream Media."

Don't miss out!

And get the May 2019 Issue for FREE!

Followers - Click "follow" to get an email alert for new articles

Kirk Lindstrom's Investment Letter Performance