Don't Miss Out On Great Gains! - Best Investment Newsletter


Click for FREE sample of Kirk Lindstrom's Investment Letter

Don't miss out! Subscribe Now

google.com, pub-7001134751860982, DIRECT, f08c47fec0942fa0

Search For More

Saturday, December 31, 2022

2022 US Stock & Bond Market Summary for New Year's Eve

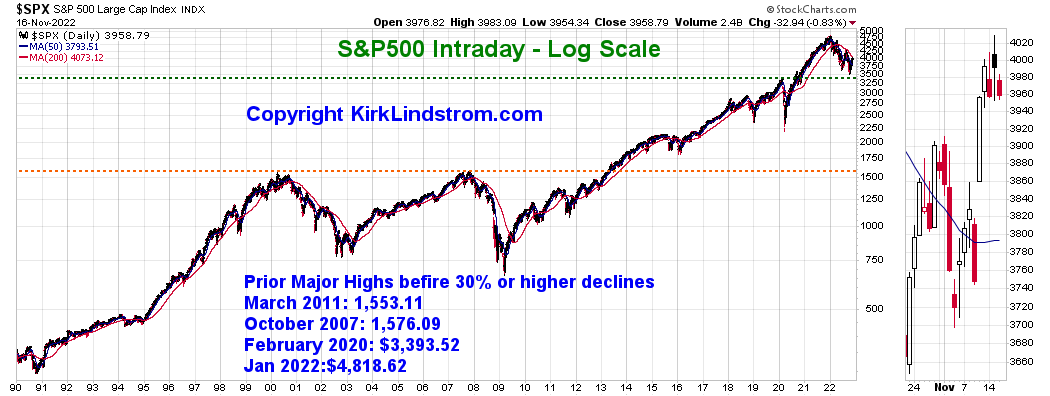
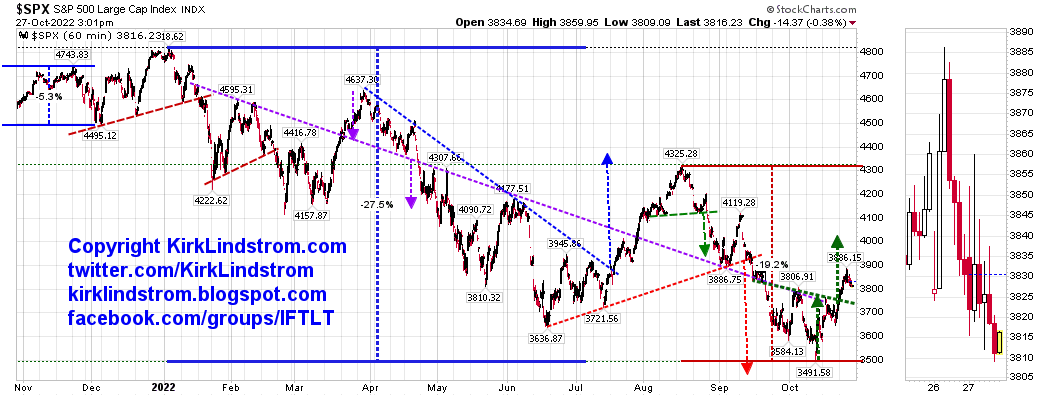
The S&P 500 index fell 19.44% in 2022 and ended the year down 19.55% from its record high set in early January 2022.  

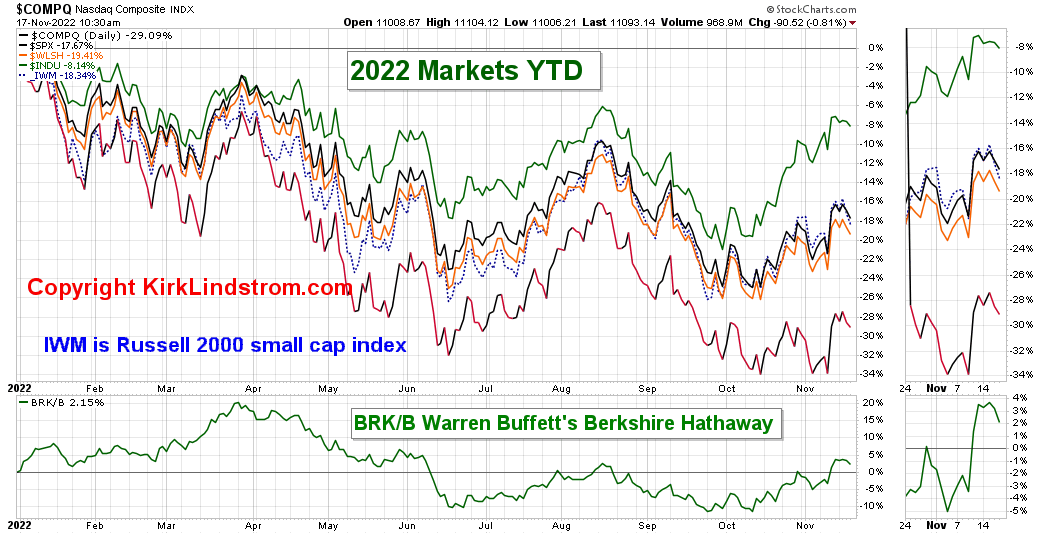
US Stock Markets YTD


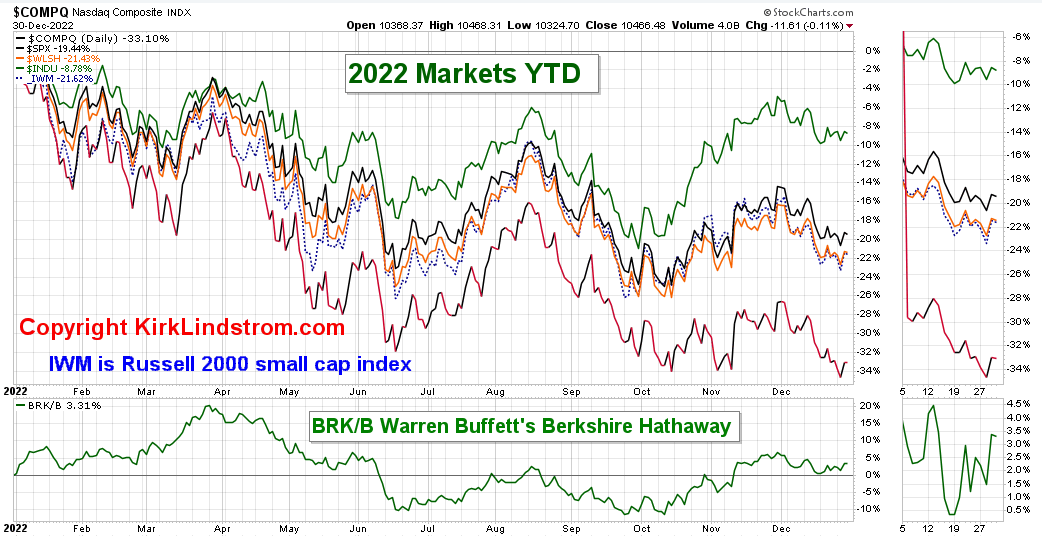
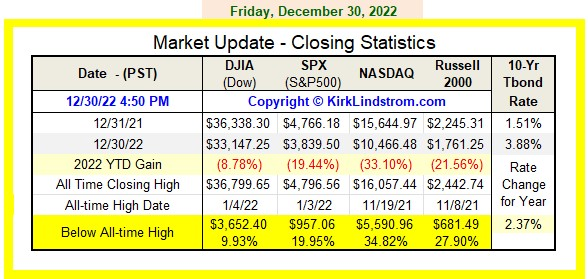
With dividends included, the S&P 500 lost 18.2% using Vanguard's VFIAX "S&P 500 Index" Admiral Fund.  US Small cap stocks did worse, causing Vanguard's VTSAX "Total Stock Market Admiral Fund" to lose 19.5% with dividends.  After 20 years of significant outperformance, Vanguard's REIT (real estate investment trust) index fund, VGSLX, lost 26.2% which still beat the Nasdaq which lost 33.1% in 2022!

2022 was one of the worst years on record for 60:40 stock:bond investors in history since both went down.  Here is a chart for illustration.

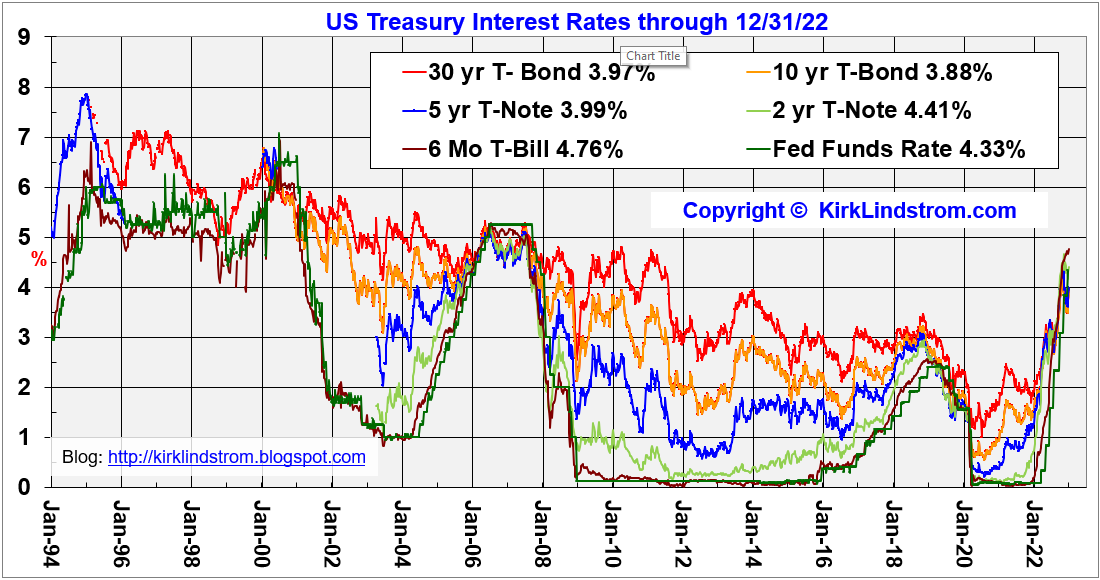
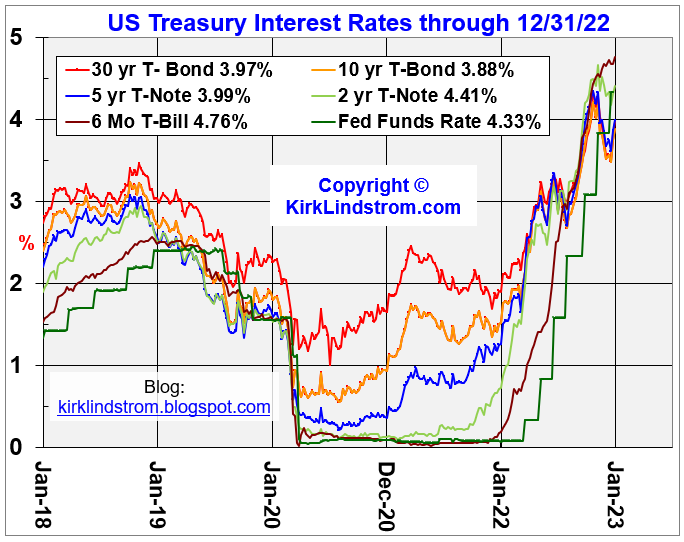
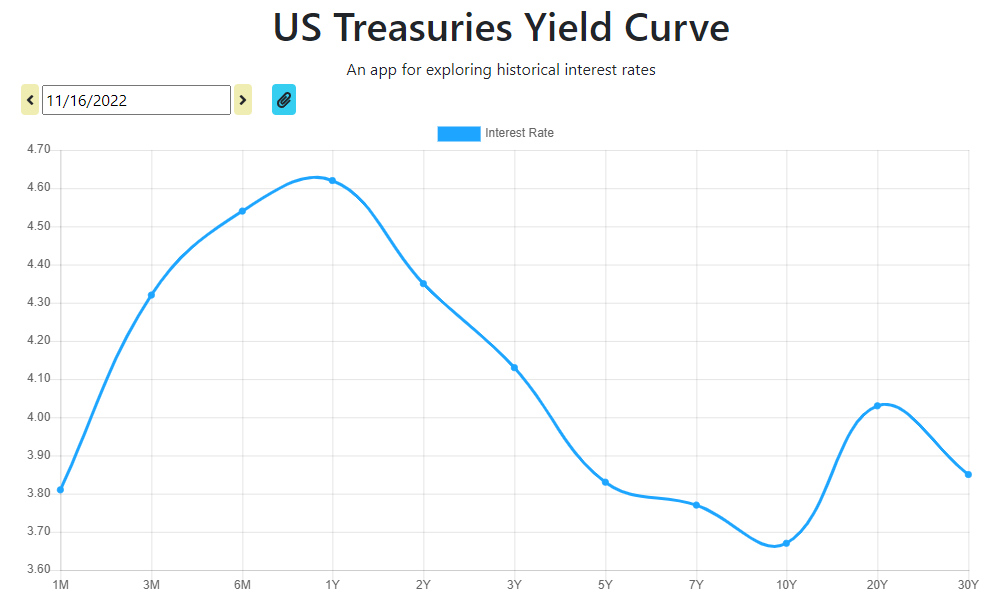
US interest rates soared this year as the Federal Reserved, late to the "inflation is not transitory" party, raised rates at a rapid pace which led to negative returns for both stocks and bonds. 

US Treasury Rates through 12/31/22


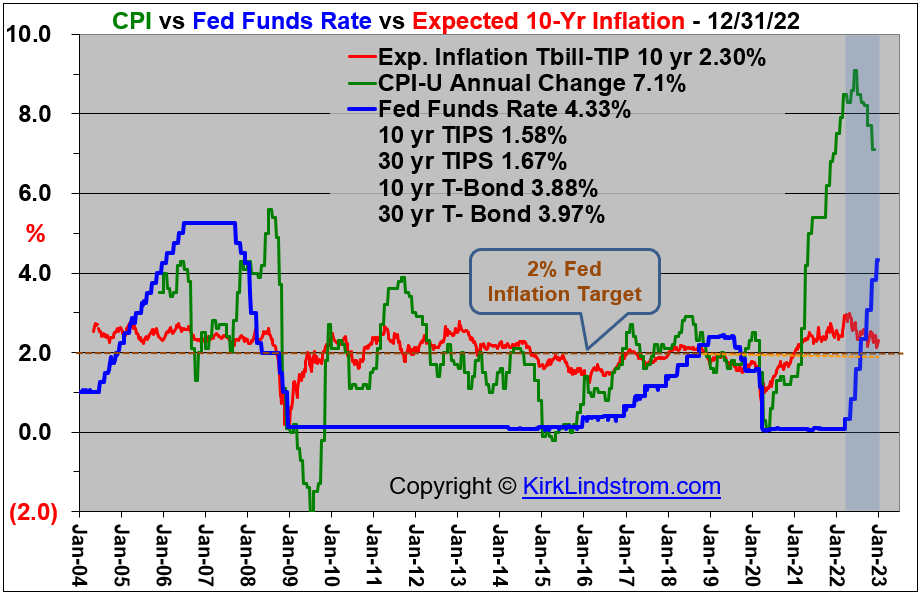
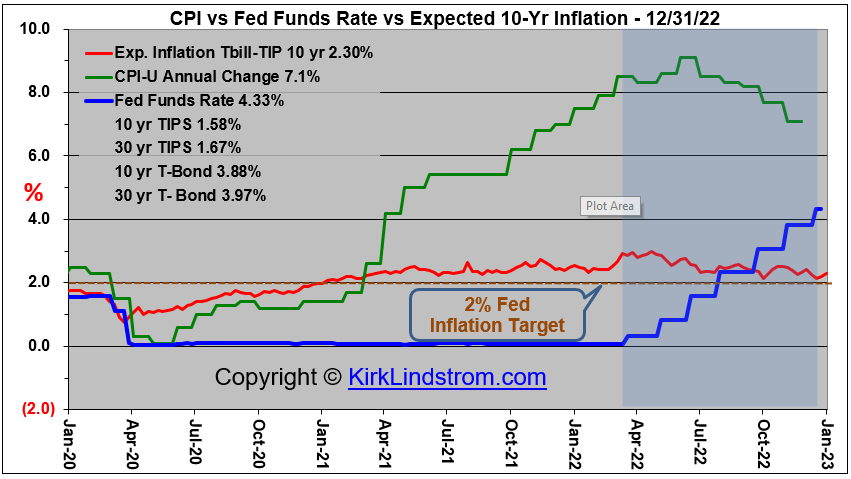
The good news is inflation as measured by annual changes in CPI-U has begun to fall.  A big concern is will it fall fast enough to not get built into the economy and will the Fed engineer a "soft landing" which is lower inflation without causing a recession.  

CPI vs Expected Inflation Rate


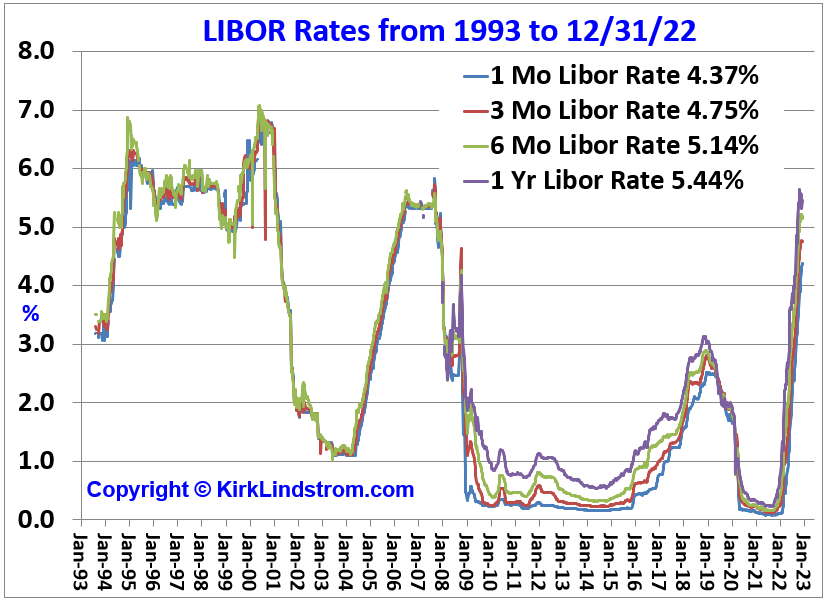
LIBOR Rates from 1993 to 12/31/22

My "Newsletter Explore Portfolio" had a good year beating the S&P 500 by 5.5% but it still suffered a decline as I don't believe in trying to jump in and out of the market.  I trade around core positions in my stocks (using buy and sell prices listed ahead of time on page 5 of my monthly newsletter) which does add to return and my large cash position buffers the portfolio in down markets.  
Kirk Lindstrom's Investment Letter
To see what stocks and ETFs are in my portfolio and get a full list of on my price targets to both take profits or buy more:
 Subscribe NOW  and get
the
 December 2022 
Issue for FREE!!

 Subscribe NOW


Thursday, December 29, 2022

State Street Sentiment Index Plunges

 Graphs of State Street Investor Confidence Index vs the S&P 500, Nasdaq & Dow
  • Global Investor Confidence decreases 14.4 Points in December to 75.9 
  • December’s reading is the lowest since the start of the pandemic 
  • Link to Press Release
Graph of State Street Investor Confidence Index vs the S&P 500

Graph of State Street Investor Confidence Index vs the Nasdaq


State Street Global Investor Confidence Index vs DJIA 

Market Update:


Kirk Lindstrom's Investment Letter
To see what stocks and ETFs are in my portfolio and get a full list of on my price targets to both take profits or buy more:
 Subscribe NOW  and get
the
 December 2022 
Issue for FREE!!
(If you mention this ad)

Thursday, November 17, 2022

Kirk's Sentiment Charts

🐂📈Kirk Lindstrom's Investor Bull/Bear Sentiment Charts for 11/17/22 📉🐻

Reminder, you can subscribe or follow this feed and get sent emails by Google when I post new charts and articles.

II Investors Intelligence & AAII (American Association of Individual Investors) Sentiment Updates

II Bulls and Bears Sentiment Graphs

  • % Bulls = 38.6
  • % Bears = 32.8


AAII Bulls and Bears Sentiment Graphs: The AAII Investor Sentiment Survey measures the percentage of individual investors who are bullish, bearish, and neutral on the stock market for the next six months.

As of   11/17/22, the AAII members are:
  1. Bullish: 33.5%
  2. Neutral: 26.3%
  3. Bearish: 40.2%


Historical AAII Data: 


Gooooood morning South Bay Area!

Sunrise Image from the Sutro Tower in San Francisco


Market Charts


The US Treasury Yield curve is most inverted since 1982, 40 years ago!

https://www.ustreasuryyieldcurve.com/


Kirk Lindstrom's Investment Letter
To see what stocks and ETFs are in my portfolio and get a full list of on my price targets to both take profits or buy more:
 Subscribe NOW  and get
the
 November 2022 
Issue for FREE!!
(If you mention this ad)
end:  7:37 AM PST 11/17/22

Thursday, October 27, 2022

Kirk Lindstrom's Investor Sentiment Charts

 🐂📈Kirk Lindstrom's Investor Bull/Bear Sentiment Charts for 10/27/22 📉🐻

Reminder, you can subscribe or follow this feed and get sent emails by Google when I post new charts and articles.

Graph of the American Association of Individual Investors (AAII) Bulls Minus Bears Sentiment Indicator vs the Dow.  


 Graph of the II, Investors Intelligence, Bulls and Bears Survey vs Log Dow Graphs  


Graphs of the "State Street Investor Confidence Index" vs the Stock Markets


CNN's Fear & Greed Index


CPC Put Call Ratio


Dow vs Oscillators 


Kirk Lindstrom's Investment Letter

To see what stocks and ETFs are on my buy list and what are my price targets:
 Subscribe NOW  and get
the
 October 2022 
Issue for FREE!!
(If you mention this ad)
🐻📉Kirk Lindstrom's Bull and Bear Sentiment Charts🐂📈

Next Article: 

The Biden Barometer - Key Financial Markets Under President Biden

Friday, October 21, 2022

2022 Treasury Deficit Adds 1.4 Trillion Dollars - National Debt at $31.2 Trillion

I updated my revenue, spending & deficit table for the US Treasury.  Clearly tax collections continue to rise despite the lower corporate tax rate.  

  • The "problem" is SPENDING has gone up much faster than revenue.   
  • During fiscal 2022, total US Treasury revenue grew 21.0% to $4.9 trillion while spending fell only 8.0% to $6.3 trillion thus adding another $1.4 trillion to the deficit.   
  • The largest Outlay for September was for $449 billion for "Education" with Medicare and Social Security tying for 2nd and 3rd at "only" $104 billion each.   
Spending fell as the government isn't paying workers to not work and stay home to slow the spread of COVID-19. To get a better idea, below are some comparisons to fiscal year1999 before COVID impacted our economy.

Compare FY 2022 with FY 2019:
  • In FY 2019 before spending on COVID-19, the total deficit for the year was "only" $0.98 trillion, thus the deficit grew 40% while revenue collected from taxes grew!
  • Total Revenue in 2019 was $3.33T and total spending was $4.11T
  • Total Revenue in 2022 was $4.90T and total spending was $6.27T  
  • Between FY 2019 and FY 2022
    • Revenue grew $0.76T or 23%
    • Spending grew $2.16T or 53%


Receipts, Outlays, and Surplus/Deficit for September 2022

Receipts by Source: Outlays by Function:
Figure 2. Cumulative Receipts, Outlays, and Surplus/Deficit through Fiscal Year 2022


Kirk Lindstrom's Investment Letter

To see what stocks and ETFs are on my buy list and what are my price targets:
 Subscribe NOW  and get
the
 October 2022 
Issue for FREE!!!
(If you mention this ad)
US National Debt now exceeds $31 TRILLION dollars or $247,882 per taxpayer and $93,703 per person!  

US Debt table from https://www.usdebtclock.org/

Followers - Click "follow" to get an email alert for new articles

Kirk Lindstrom's Investment Letter Performance