
II, Investors Intelligence, Bulls and Bears Survey vs Log Dow Graphs
 |
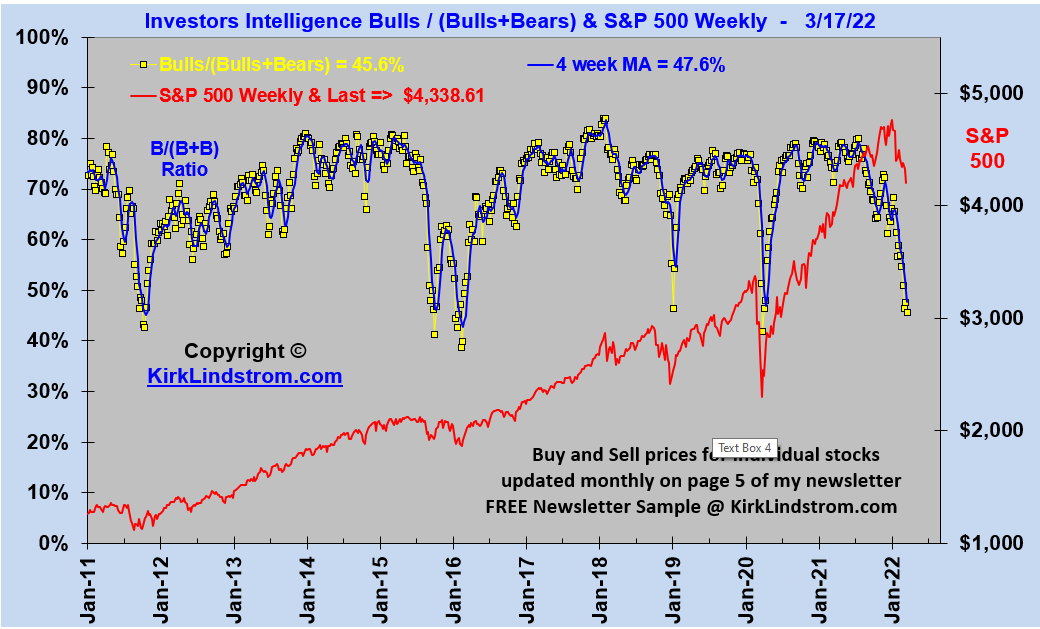
| II Bulls Over Bulls Plus Bears 1998 to Now |
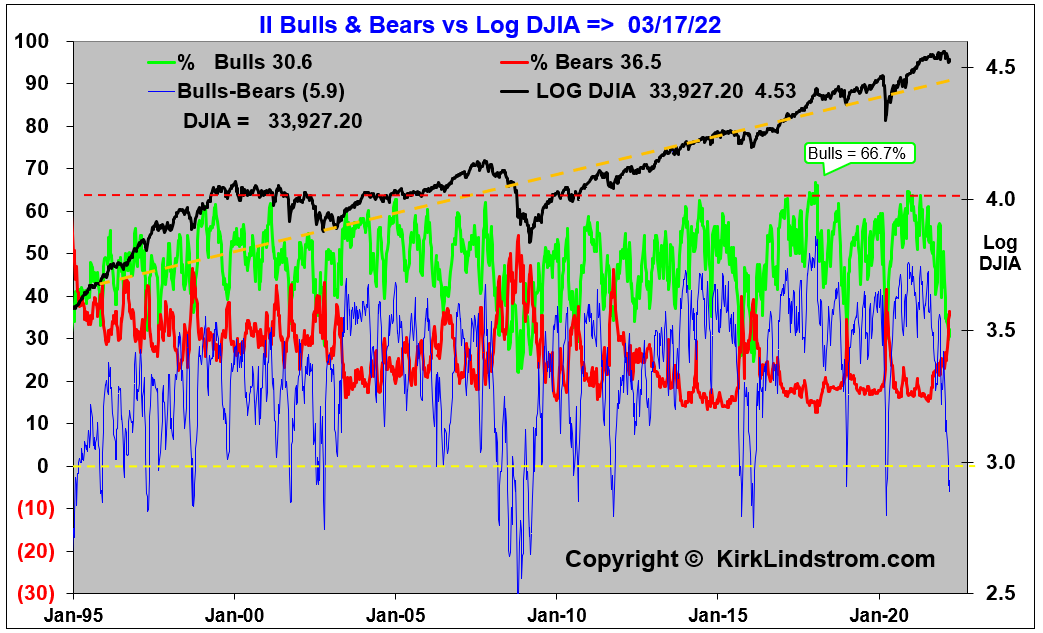 |
| II Bulls & Bears vs Log DJIA |
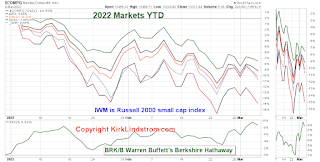
#IIBullsBears #Sentiment #StockMarket #SPY $SPX $SPY $INDU $DIA #Stocks
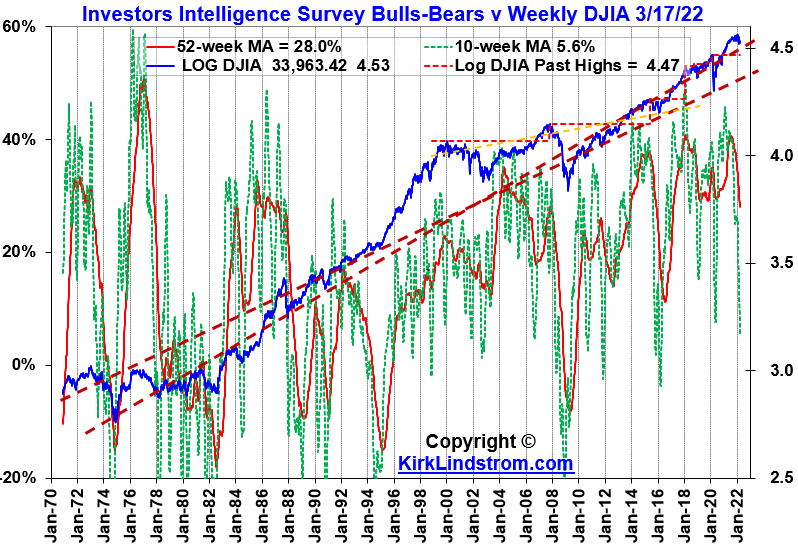 |
| Investors Intelligence Survey Bulls-Bears vs Weekly DJIA |
 |
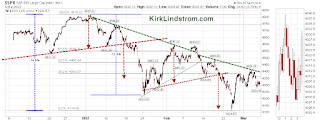
| II Bulls & Bears vs Log DJIA => 03/17/22 |
Graph of the American Association of Individual Investors (AAII) Bulls Minus Bears Sentiment Indicator vs the Dow.


More about Kirk Lindstrom's Investment Letter Service:
- Subscribe NOW and get the March 2022 Issue for FREE!!!


 kirklindstrom.com
