

The all-time intraday high was many weeks ago on Friday September 19, 2014.


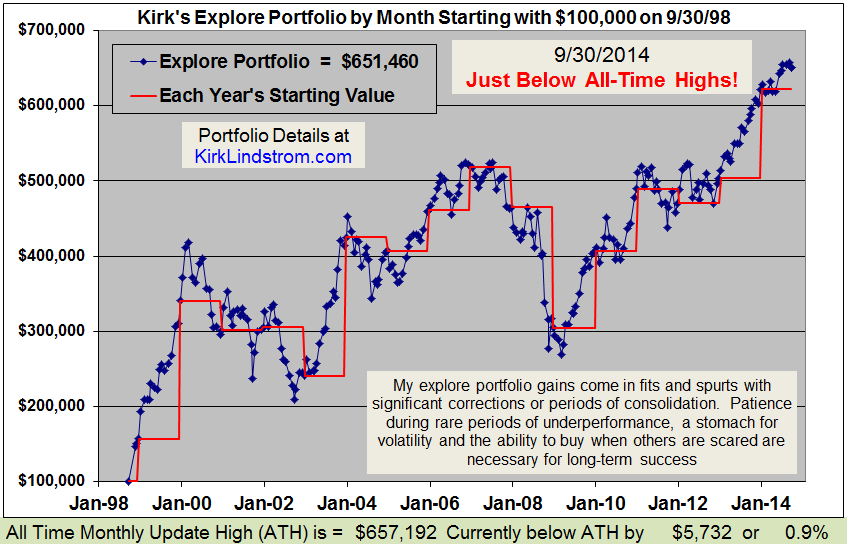
This shows the markets in graphical form.

ARTICLE IN PROGRESS.
Come back Saturday when it should be complete.
xxxx


Saturday, October 11, 2014
Fear & Greed Index Record Low - Put Call Ratio Bullish


Friday, October 10, 2014Note the time and date on that chart shows Oct 10 at 4:028 pm!
Market Update: Russell 2000 Down 13% with Fear & Greed Index at Record Low of 2


 kirklindstrom.com