Don't Miss Out On Great Gains! - Best Investment Newsletter


Click for FREE sample of Kirk Lindstrom's Investment Letter

Don't miss out! Subscribe Now

google.com, pub-7001134751860982, DIRECT, f08c47fec0942fa0

Search For More

Thursday, February 23, 2023

Kirk's Investor Sentiment Graphs and Data

  🐂📈Kirk Lindstrom's Investor Bull/Bear Sentiment Charts for 2/23/23 📉🐻

Reminder, you can subscribe or follow this feed and get sent emails by Google when I post new charts and articles. Just click "Follow" below.

II Investors Intelligence & AAII (American Association of Individual Investors) Sentiment Updates

II Bulls and Bears Sentiment Graphs

  • % Bulls = 44.4
  • % Bears = 26.4
  • % Bulls / (% Bulls +% Bears) = 62.7
Click charts to view full size


AAII Bulls and Bears Sentiment Graphs: The AAII Investor Sentiment Survey measures the percentage of individual investors who are bullish, bearish, and neutral on the stock market for the next six months.
As of   2/23/23, the AAII members are:
  1. Bullish: 21.6%
  2. Neutral: 38.6%
  3. Bearish: 39.8%
  4. Current Data from https://www.aaii.com/sentimentsurvey 


State Street Investor Confidence Index

The Global Investor Confidence Index increased to 77.5, up 1.1 points from January’s revised reading of 76.4. The increase was led by a 5.8 point rise in Asian ICI to 98.2, as well as a 4.1 point increase in European ICI to 106.4. North American ICI, meanwhile, fell 0.3 points to 72.8. 

The Investor Confidence Index was developed at State Street Associates, State Street Global Markets research and advisory services business. It measures investor confidence or risk appetite quantitatively by analyzing the actual buying and selling patterns of institutional investors. The index assigns a precise meaning to changes in investor risk appetite: the greater the percentage allocation to equities, the higher risk appetite or confidence. A reading of 100 is neutral; it is the level at which investors are neither increasing nor decreasing their long-term allocations to risky assets. The index differs from survey-based measures in that it is based on the actual trades, as opposed to opinions, of institutional investors.

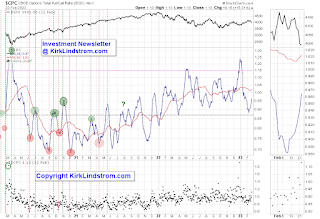
CPC The more recent signals are left to the user.  See page 6 of my February 2023 Newsletter for more about what this indicator means to me.

NAII 
Exposure Index 


NAAIM member firms who are active money managers are asked each week to provide a number which represents their overall equity exposure at the market close on a specific day of the week, currently Wednesdays. Responses can vary widely as indicated below. Responses are tallied and averaged to provide the average long (or short) position of all NAAIM managers, as a group.

Range of Responses:
  • 200% Leveraged Short
  • 100% Fully Short
  • 0% (100% Cash or Hedged to Market Neutral)
  • 100% Fully Invested
  • 200% Leveraged Long
  • Source
More Sentiment Information : Sentiment charts are covered on page 6 of my newsletter with updates during the year for what the different types of sentiment charts mean to me. This blog is an easy place to give my subscribers updates of charts too numerous to add each month to the newsletter but they might find worthwhile. And for others... they can window shop or ignore as it suits them.


Kirk Lindstrom's Investment Letter

To see what stocks and ETFs are in my portfolio and get a full list of on my price targets to both take profits or buy more:
 Subscribe NOW  and get
the
 February 2023 
Issue for FREE!!
(If you mention this ad)

Reminder, you can subscribe to this feed for free to get sent emails by Google when I post new charts and articles. Just click "Follow" below.

Friday, February 10, 2023

ECRI's WLI, WLI Growth Rate & Quarterly GDP Growth Graphs

ECRI WLI, WLI Growth Rate & Quarterly GDP Growth for 2/10/23


ECRI Recession & Inflation Calls:

Feb. 9, 2023 FACE Interview: Lakshman calls the pullback in inflation The Immaculate Disinflation.
"Lakshman is calling the pullback in inflation ,"The Immaculate Disinflation. He is still expecting a hard landing from last June's forecast."

Jan. 13, 2023 Don't Be Fooled, A Recession Really Is Coming


Lakshman is the co-founder of the Economic Cycle Research Institute and has more than 30 years of analyzing business cycles under his belt. Lakshman and Matt talk about the recent market volatility, inflation, and the Federal Reserve. They also cover why Lakshman thinks a recession could be coming from a cyclical perspective and whether the bond market could lead us out of a recession. 00:00 Stansberry Conference Overview 5:41 Lakshman's View on Current Markets 7:49 Peak Inflation & Fed Rate Hikes 11:12 Opportunities for Investors 15:09 Are We In a Recession? 20:49 When Will the Bear Market Hit Bottom? 22:58 Investment to Own for the Next 10 Years


Kirk Lindstrom's Investment Letter
To see what stocks and ETFs are in my portfolio and get a full list of on my price targets to both take profits or buy more:
 Subscribe NOW  and get
the
 February 2023 
Issue for FREE!!
(If you mention this ad)


Reminder, you can subscribe or follow this feed and get sent emails by Google when I post new charts and articles. Just click "Follow" below.

.

Thursday, February 09, 2023

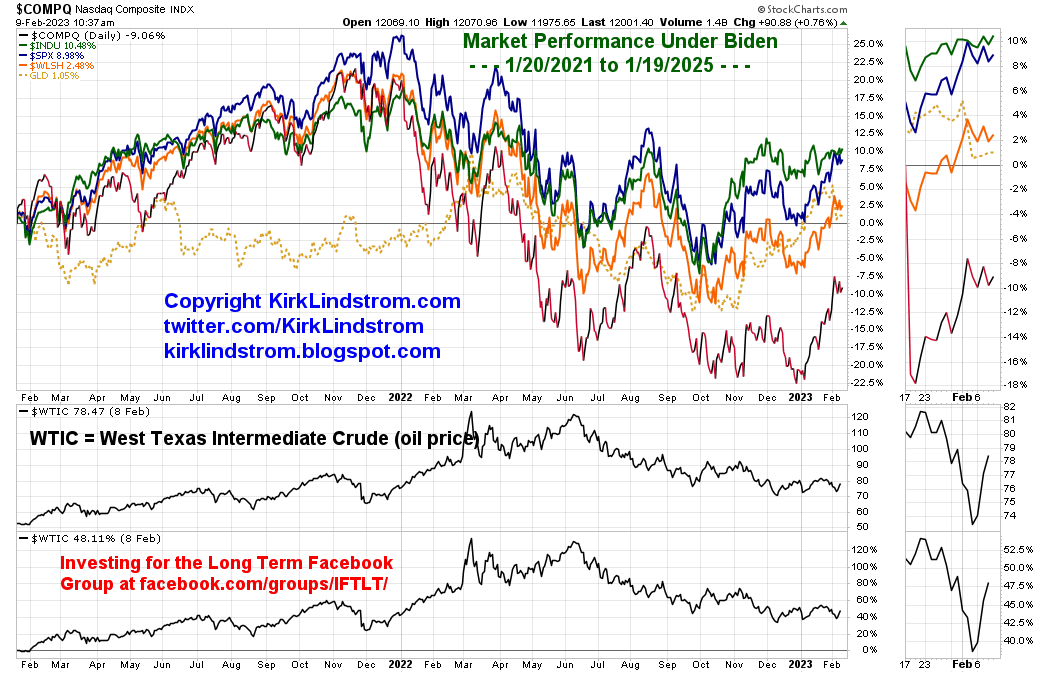
The Biden Barometer - Key Financial Markets Under President Biden

 2/9/23 #BidenBarometer

Reminder, you can subscribe or follow this feed and get sent emails by Google when I post new charts and articles. Just click "Follow" below.

The "Biden Barometer" is a measure of how stock, gold, oil, bitcoin and natural gas prices have done while President Joe Biden has been the 46th president of the United States.  

🐂Up through 2/8/23:

  • Gold up 1.05%
  • Wilshire 5000 Total Stock Market ($WLSH) up 2.48%
  • S&P 500 ($SPX) up 8.4%
  • DJIA ($INDU) 9.76% 
  • 🛢Oil Price (WTIC) up 48.1%
🐻Down through 2/8/23:
  • Natural Gas ($NATGAS) down 5.89%
  • Nasdaq Composite ($COMPQ) down 17.65%
  • Bitcoin ($BTUSD) down 37.13%


Natural gas has had a shocking, volatile ride under President Biden going from as much as 280% up to now down 6%!  

Trump Barometer:  Markets under US President #45, Donald Trump:


Kirk Lindstrom's Investment Letter
To see what stocks and ETFs are in my portfolio and get a full list of on my price targets to both take profits or buy more:
 Subscribe NOW  and get
the
 February 2023 
Issue for FREE!!
(If you mention this ad)


Reminder, you can subscribe or follow this feed and get sent emails by Google when I post new charts and articles. Just click "Follow" below.

xx

Kirk Lindstrom's Sentiment Charts

  🐂📈Kirk Lindstrom's Investor Bull/Bear Sentiment Charts for 2/9/23 📉🐻

Reminder, you can subscribe or follow this feed and get sent emails by Google when I post new charts and articles. Just click "Follow" below.

II Investors Intelligence & AAII (American Association of Individual Investors) Sentiment Updates

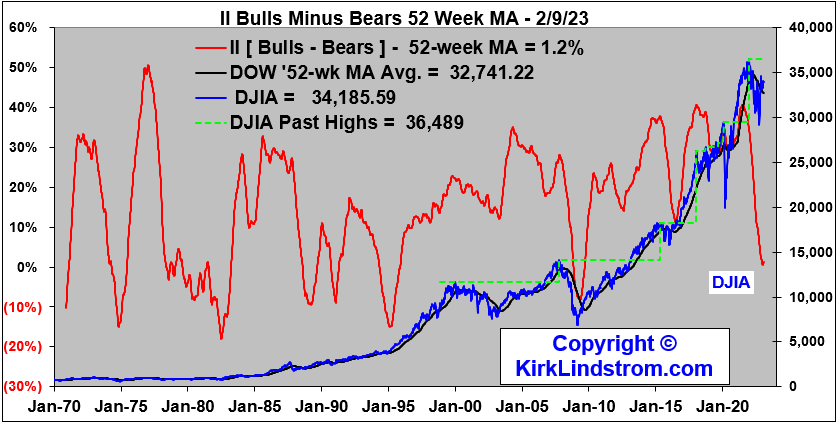
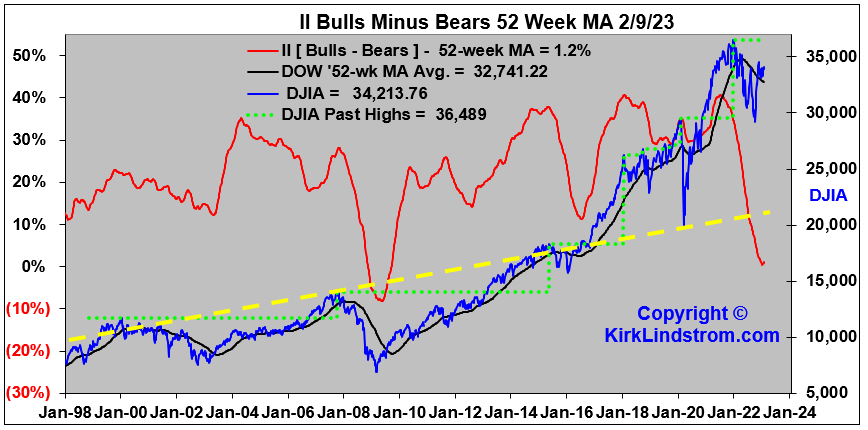
II Bulls and Bears Sentiment Graphs

  • % Bulls = 48.6
  • % Bears = 25.7.8
Note how the 52-week moving average has turned up on the first four long-term II Sentiment graphs.


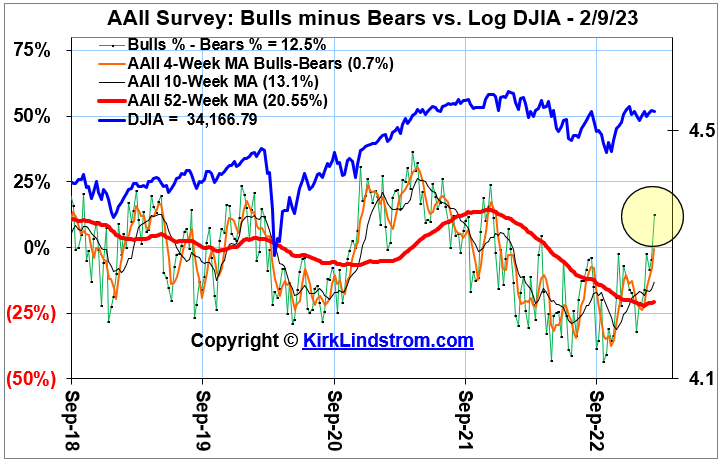
AAII Bulls and Bears Sentiment Graphs: The AAII Investor Sentiment Survey measures the percentage of individual investors who are bullish, bearish, and neutral on the stock market for the next six months.
As of   2/9/23, the AAII members are:
  1. Bullish: 37.5%
  2. Neutral: 37.5%
  3. Bearish: 25.0%
  4. Current Data from https://www.aaii.com/sentimentsurvey 

Graphs of the American Association of Individual Investors (AAII) Bulls Minus Bears Sentiment Indicator vs the Dow:


CPC Put:Call Ratio:

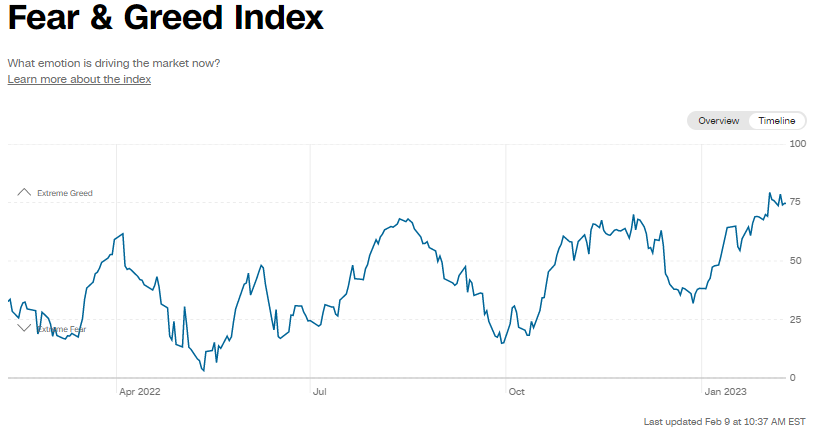
CNN Fear and Greed Index

More Information : These charts are covered on page 6 of my newsletter with updates during the year for what the different types of sentiment charts mean to me. This blog is an easy place to give my subscribers updates of charts too numerous to add each month to the newsletter but they might find worthwhile. And for others... they can window shop or ignore as it suits them.
Kirk Lindstrom's Investment Letter
To see what stocks and ETFs are in my portfolio and get a full list of on my price targets to both take profits or buy more:
 Subscribe NOW  and get
the
 February 2023 
Issue for FREE!!
(If you mention this ad)

Followers - Click "follow" to get an email alert for new articles

Kirk Lindstrom's Investment Letter Performance