
Here is a graph of the STAX Schwab Trading Activity Index Over Time, from January 2019 through Today.
Note that even with the markets at record highs last week, the STAX remains closer to a 6-year low than a 6-year high.
Click Images to See Full Size
Best in Full Screen

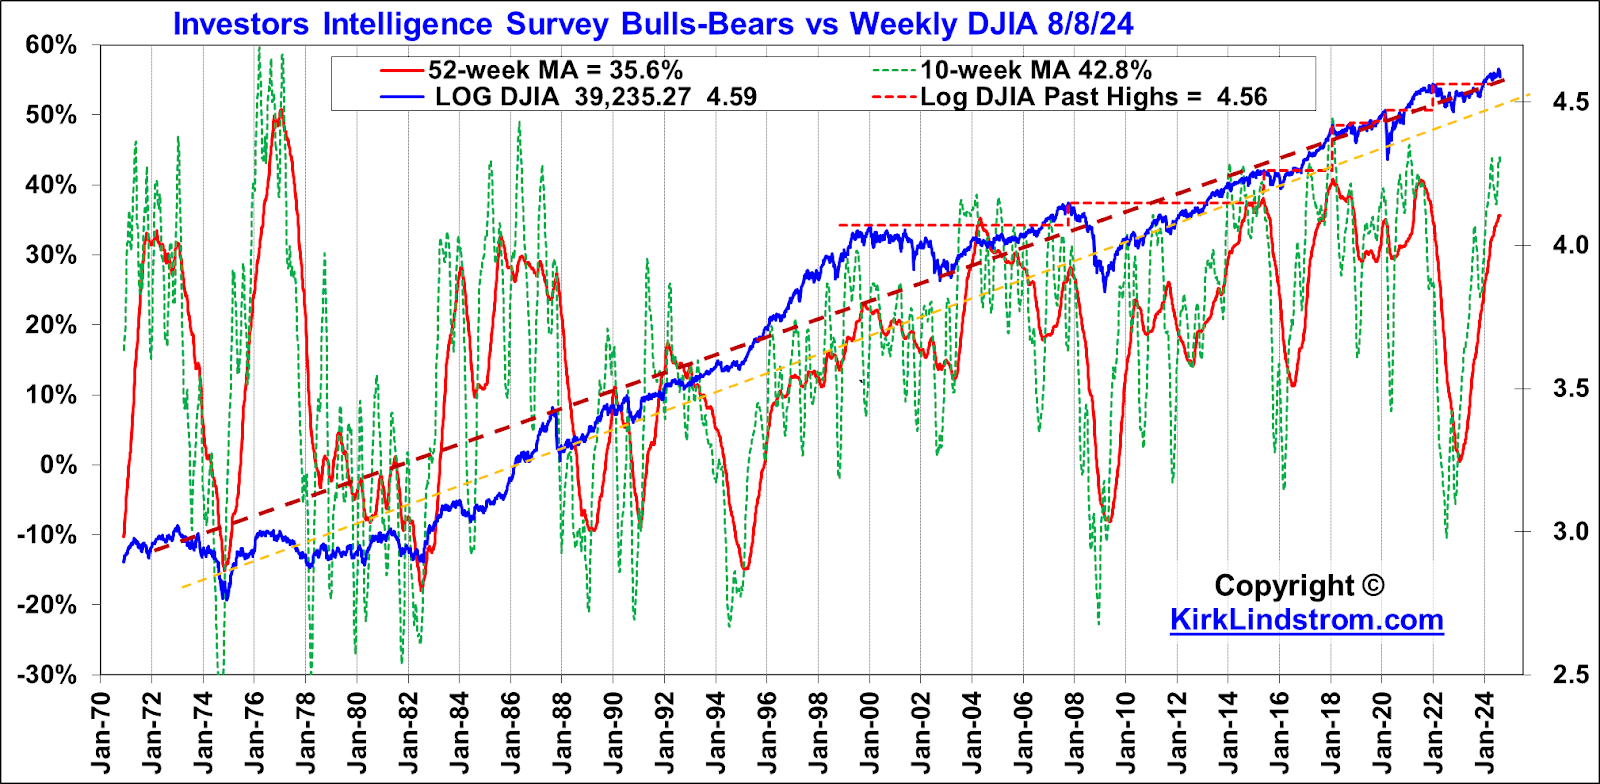
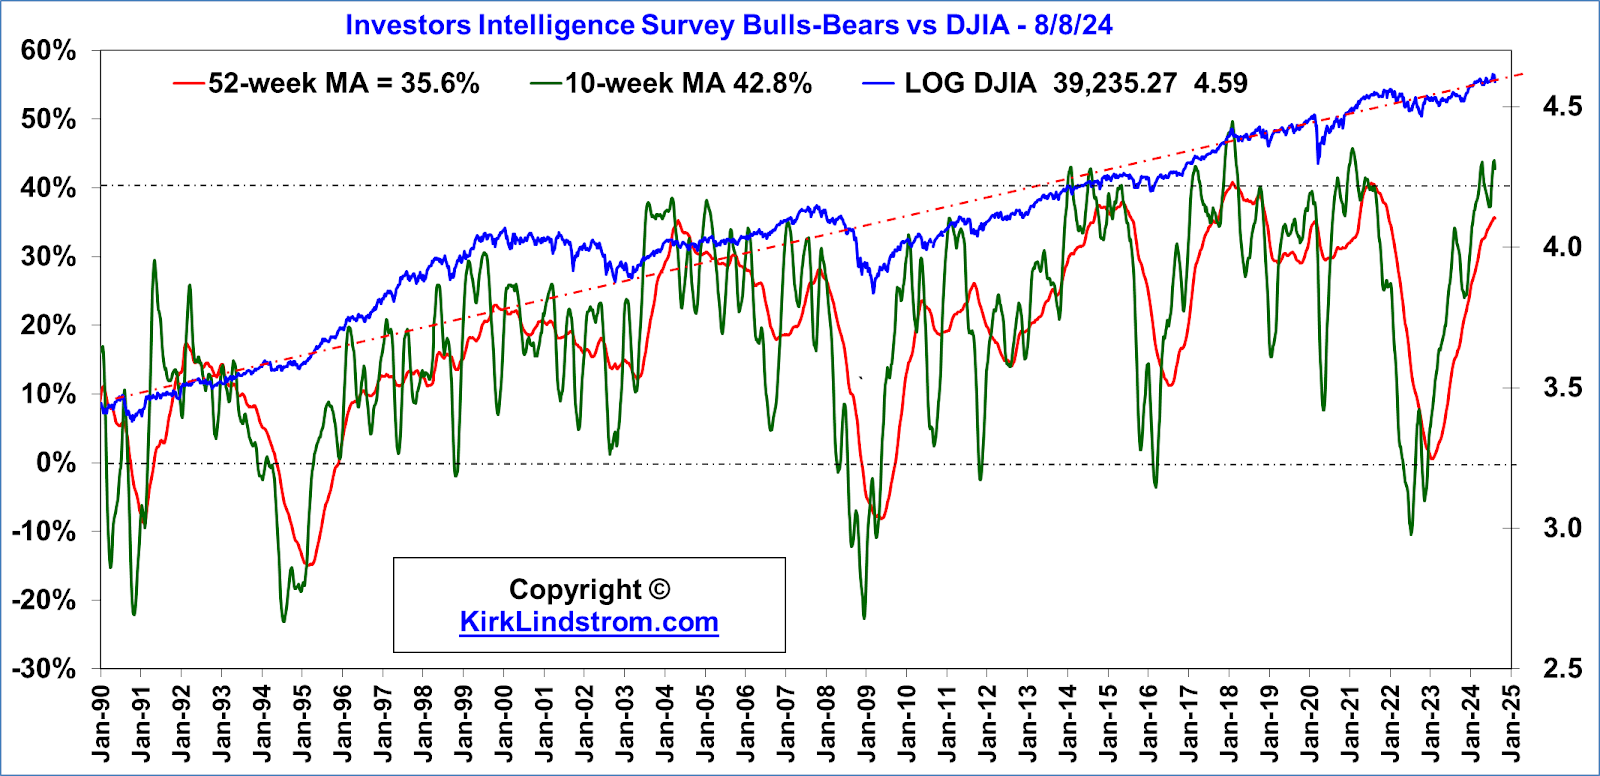
Kirk's DJIA vs Oscillators Chart: "Everything before the black dot-dash line is math, everything after is art" and art is aka "guestimates"

Market Update for 11/8/24

Kirk Lindstrom's Investment Letter
To see what stocks and ETFs are in my "Explore Portfolio" and get a full list of on my price targets to both take profits or buy more:
Subscribe NOW and get
the December 2024 Issue for FREE!!!
(If you mention this ad)
the December 2024 Issue for FREE!!!
(If you mention this ad)


For more information on the STAX, see https://www.schwab.com/investment-research/stax/view-schwab-trading-activity-index


 kirklindstrom.com
