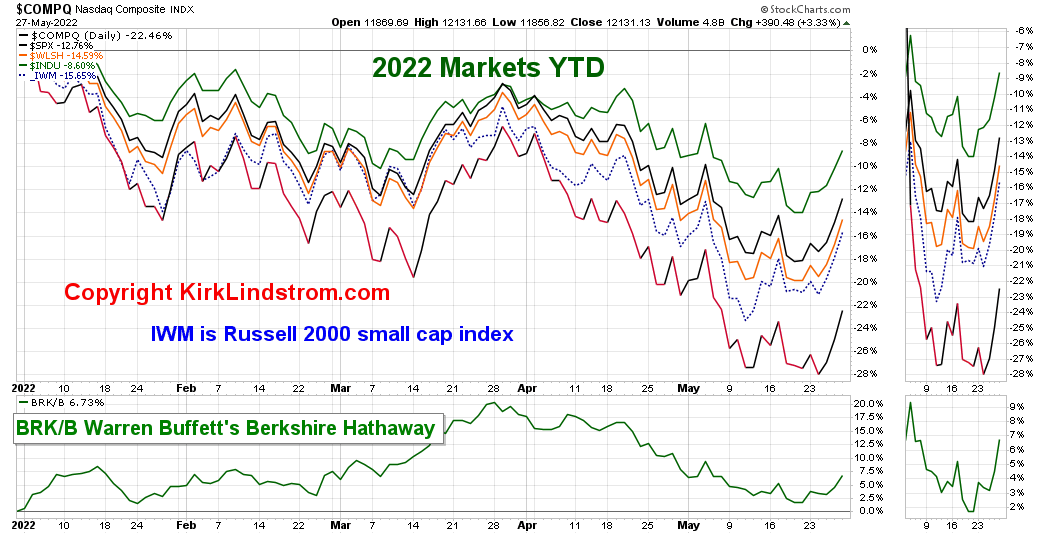
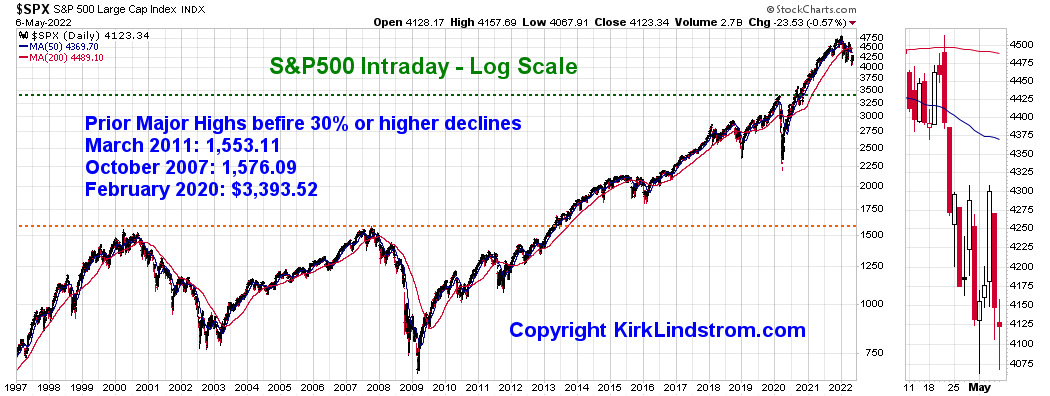
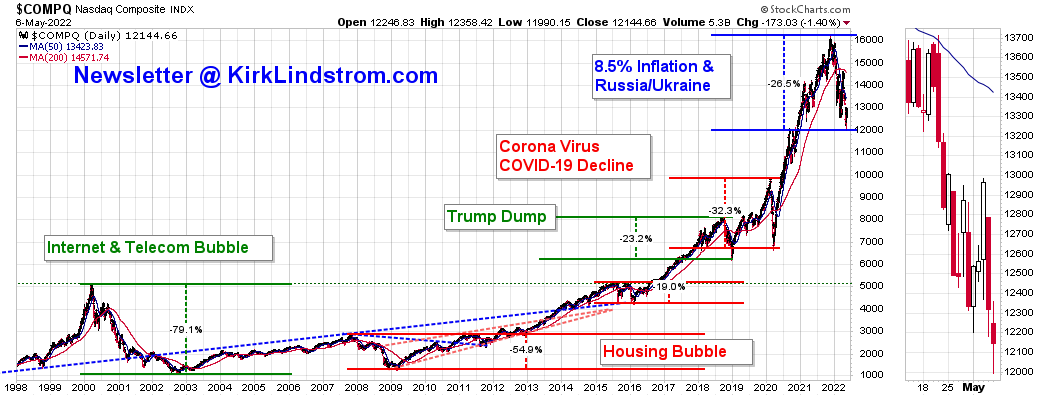
Market update for Friday May 6, 2022. Currently the Nasdaq and Russell 2000 small cap indexes are in bear markets (down over 20% from their highs) while the Dow and S&P 500 indexes are in major, double digit corrections off their highs.
 |
| Market Update Closing Values |
For those of us who raised cash near record highs at the start of the year when interest rates were low with valuations and sentiment very high, this decline is an opportunity to start putting some of the cash we raised back into the markets.
I've sent several email alerts to my subscribers reminding them some of the stocks in my newsletter hit the "buy levels" posted in the last newsletter. Selling SOME near market tops as stocks go higher and higher makes it easier to survive these big declines because rather than panic, we look forward to stock prices falling low enough to trigger my buys listed ahead of time.
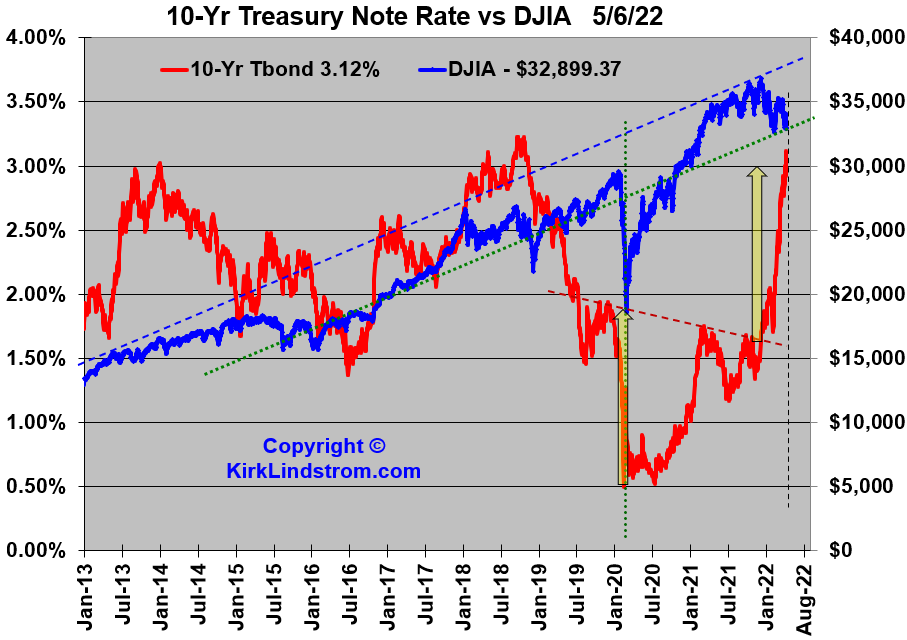 |
| 10-Yr Treasury Note Rate vs DJIA |
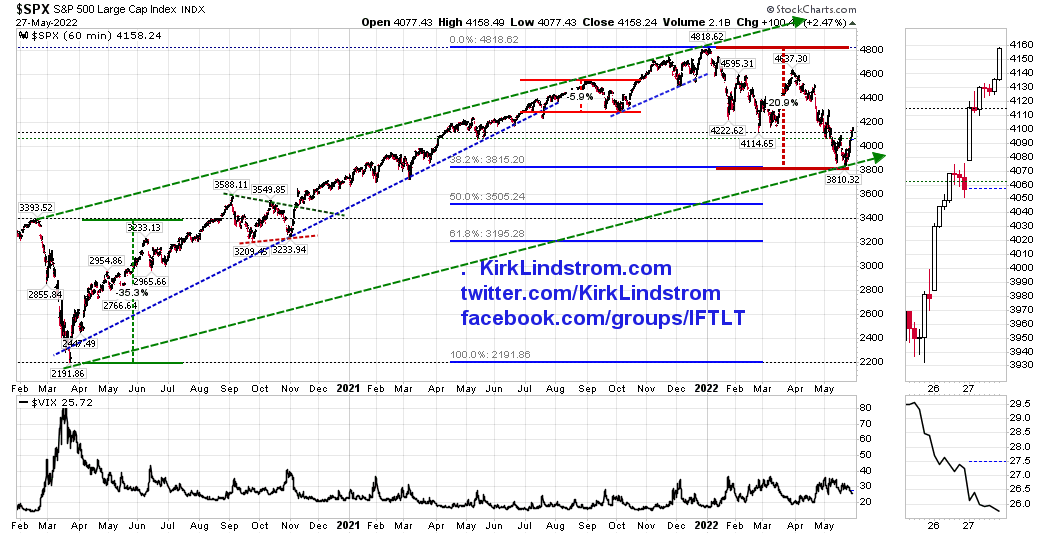
S&P 500 Graphs
NASDAQ Charts
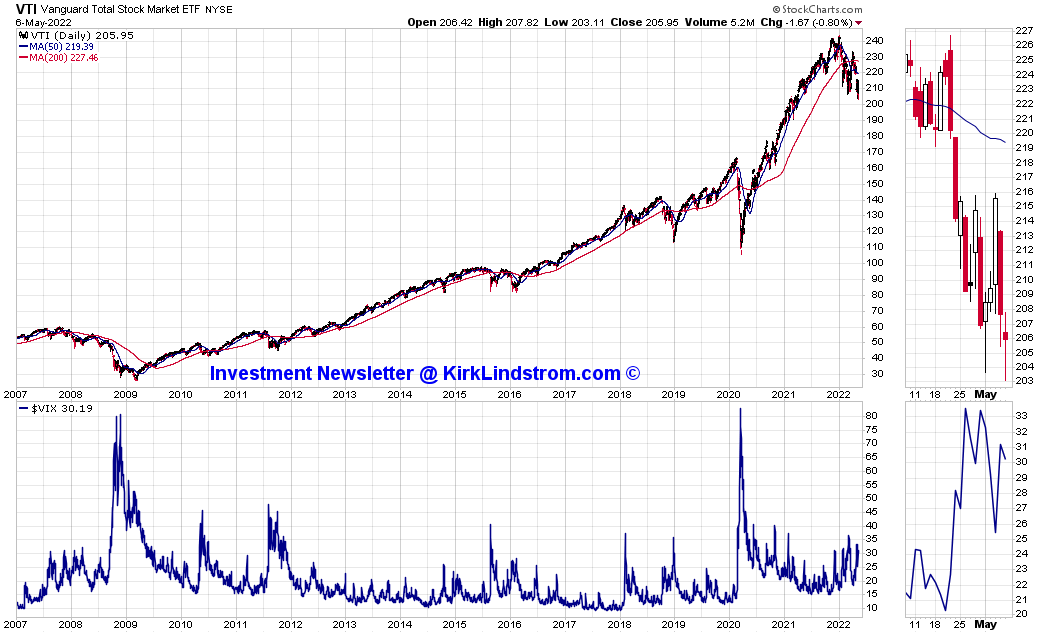
VTI - Vanguard's Total Stock Market Fund
A rising Fed Funds Rate was not bad news for the stock market coming out of the Great Recession and the telecom/internet bubble collapses:
 |
US Fed Funds Rate vs. S&P 500
|
 |
TIPS Core Yield vs S&P 500
More about TIPS including when to buy them is covered in my newsletter.
|
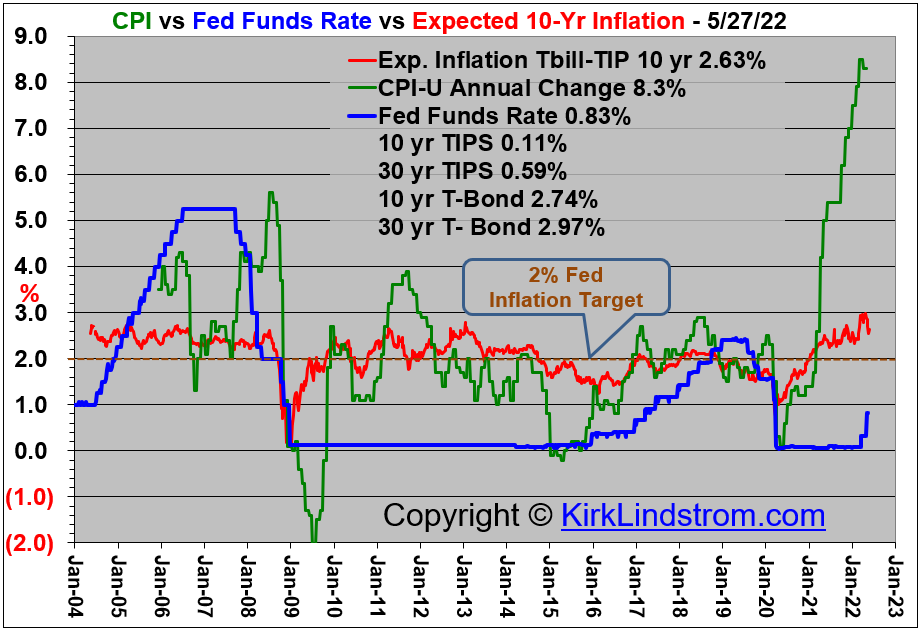
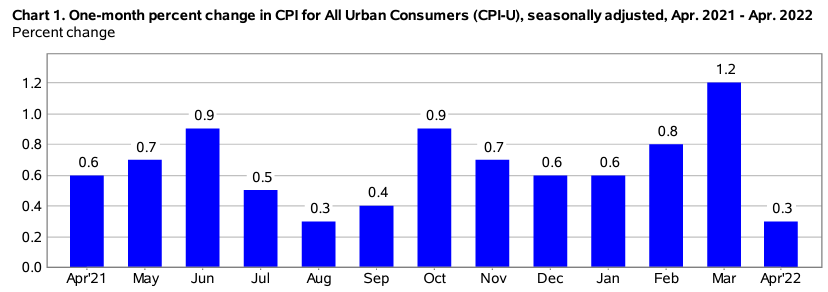
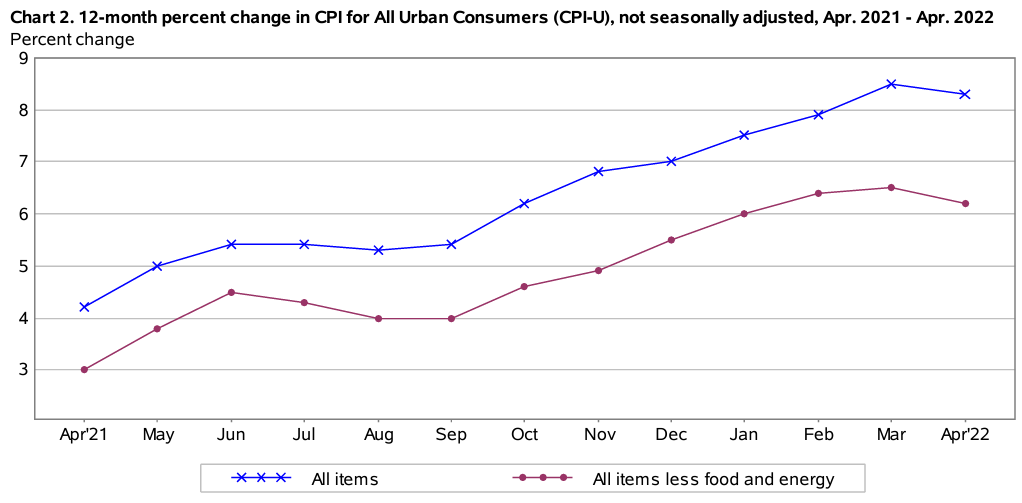
Can the Fed engineer the elusive "soft landing" to tame inflation currently running at 8.5% without pushing the US economy into another recession?
How do you invest in such difficult times?
First off, I'd start with people who have been recommending TIPS and I-Bonds in their newsletters as I have... start by reading:
Then subscribe to:
Kirk Lindstrom's Investment Letter Service


 kirklindstrom.com
