Don't Miss Out On Great Gains! - Best Investment Newsletter


Click for FREE sample of Kirk Lindstrom's Investment Letter

Don't miss out! Subscribe Now

google.com, pub-7001134751860982, DIRECT, f08c47fec0942fa0

Search For More

Tuesday, December 31, 2013

Gold Head & Shoulder Top Pattern

There is a perfect head and shoulders top formation for gold that was successfully tested from below this month. 
  • For a definition, see  "Head-and-Shoulders Top."
  • Remember, this pattern is in effect until there is a close above the neckline.

After I calculate the minimum target price, I'll send an update to my newsletter subscribers with a new chart and the minimum target. 


Kirk Lindstrom's Investment Letter
Don't Miss Out!
Subscribe Now

Get December Issue for Free!
==>   My returns by year  &  New Record Highs <==
This chart shows my newsletter "Explore Portfolio" from 1998 as it makes yet another record, all-time high!


For more of my gold articles, see:


Tuesday, December 17, 2013

Elaine Garzarelli Bearish Sentiment Indicators - Buy the Pullback

"A Correction of 4-7% May Be Coming: Live Through It and Buy On the Dip," Says Investment Manager Elaine Garzarelli

From prnewswire.com

NEW YORK, Dec. 16, 2013 /PRNewswire/ -- "Our 'Sentiment Indicator' continues to be bearish, so we could see a 4-7% correction in the market," says investment manager Elaine Garzarelli, President of Garzarelli Capital, Inc. "But we are still in a bull market."

"We can't really predict when we're going to get these 4-7% corrections, but it is more likely with the sentiment indicator the way it is now. There's too much bullishness out there, and that's a contrary indicator: the more bullish the advisors are, the more bearish it is for the stock market, because it means everybody is in there already," she continues.

Dr. Garzarelli's advice on how to ride out a possible correction: "Just live through it, and buy on the dip – to buy an opportunity."

"Add to your positions in cyclical sectors of the economy – which would be technology, industrials, financials, and consumer durables," she advises.

Following is an excerpt from this week's Garzarelli Capital Client Letter:

Sentiment Indicator Continues Bearish
The budget deal, which will help growth next year, has caused concern that it may mean QE tapering could come sooner. The bipartisan deal is to set spending levels for the government for two years. It will partly replace the unpopular spending cuts with other savings and eliminate the threat of another government shutdown. The current stopgap funding measure will run out again January 15th.

The concern over the start date of QE tapering has been moving markets. Positively, inflation expectations are low and that is the major argument against a December tapering. The risk for inflation is more to the downside. The PPI declined -0.1 percent in November, with a modest 0.7 percent year-over-year gain. We do not worry about the tapering as long as consumer and business confidence holds up. Additionally, the proposed budget deal reduces some uncertainty for markets, which is another positive for markets.

Stan Fischer, the former governor of the Bank of Israel is speculated to possibly succeed Janet Yellen as vice-chair of the Fed when she takes over from Bernanke at the end of next month. Fischer has a track record of being aggressive with monetary policy to offset major shocks.

Our Indicators
Our proprietary stock market indicator composite declined to 70.5 percent from 80.0 percent due to the downgrade of the economic cycle research institute (ECRI) weekly index and the Bloomberg Financial Conditions index. A level below 30.0 percent for our composite is bearish.

Our contrarian indicator continues to rise with the number of bullish investment advisors up again and now standing at 58.2 percent, another new high for this year. The continued rise in this indicator signals a correction of 4.0 to 7.0 percent is possible, which we believe would be a good buying opportunity since our overall composite is bullish.

Our monetary indicators, which are worth 24.0 percent of our composite, remain bullish. They include the three month bill rate, interest rate momentum, the yield curve, and money supply. The Fed's easing policies continue to keep these indicators bullish. We do not expect the tapering to significantly alter them.

Corporate cash rose about +12.0 percent in the third quarter. This could lead to better employment and capital expenditures. Our operating earnings forecast for the S&P 500 is 111.00 for next year. Plugging that into our P/E model suggests fair value for the S&P 500 of 1942 (a 9.0 percent gain from current levels). The consensus earnings estimate is 122.40, 10.3 percent higher than our conservative levels.

The Bloomberg U.S. financial conditions index has turned decisively downward. We downgrade this indicator to bearish, removing six points from our composite. This indicator signals the health of the financial industry as higher levels indicate loose financial conditions.

The ECRI weekly index is downgraded to neutral, removing three and half points from our composite. The level declined this week but its growth rate is up 2.8 percent.

Our junk bond yield to 10-year T-bond yield indicator has an inverse relationship with the S&P 500. It continues on a downtrend, therefore we rank it bullish….

Kirk Lindstrom's Investment Letter
Don't Miss Out!
Subscribe Now

Get December Issue for Free!
==>   My returns by year  &  New Record Highs <==
This table shows my newsletter "Core and Explore Portfolios" from 1998 through the end of Q3


About Elaine Garzarelli
Elaine Garzarelli, President of Garzarelli Capital, Inc., is an economist with a doctorate from Drexel University in economics and statistics. She worked for major institutional brokerage firms for over 15 years while perfecting her market and industry econometric timing models, and was ranked #1 for 11 consecutive years on Institutional Investor's"All-Star" team for Quantitative Analysis and was recently inducted into the Hall of Fame. She started her own companies in 1994, and currently runs the "Sector Analysis" fund.

The Ralph and Elaine Garzarelli scholarship is available at Drexel University for women majoring in economics.

Garzarelli Capital does not warrant or guarantee the accuracy or completeness of this report nor does Garzarelli Capital assume any liability for loss of any nature that may result from reliance by any person or institution upon any such information or opinions contained herein. Such information and opinions are subject to change without notice and are for general information only.

For further information, to hear Dr. Garzarelli's recommendations, receive this week's entire Garzarelli Capital Weekly Investment Letter, or to speak with Dr. Garzarelli, please contact Temin and Company at 212-588-8788 or news@temin.co.

Monday, December 16, 2013

AGEN: Agenus Announces Positive Phase 2 Brain Cancer Vaccine Results

Positive Phase 2 Results from Agenus’ Brain Cancer Vaccine Published in Neuro-Oncology

Results Show Improved Survival Against Aggressive Brain Cancer; More Than 90% of Patients Alive After Six Months.  

AGEN's stock surged over 20% this morning on the news

From Business Wire press release:
LEXINGTON, Mass.--(BUSINESS WIRE)-- Agenus Inc. 2 hours ago

Agenus Inc. (AGEN), a biotechnology company developing novel immune system activating treatments for cancers and infectious diseases, today announced results published from a Phase 2 study demonstrated that more than 90% of the patients treated with Prophage Series G-200 were alive at six months after surgery and 30% were alive at twelve months. Additionally, the median overall survival was approximately eleven months. This compares favorably to the expected median survival for recurrent Glioblastoma multiforme (GBM) patients of three to nine months1-7. The primary objective of this multi-center, single arm Phase 2 trial was to assess the survival rate at six months.

The data was published in a manuscript in Neuro-Oncology, the official journal of the Society of Neuro-Oncology. GBM is the most common and most aggressive form of primary brain cancer. Despite approved therapy patients with GBM face a poor prognosis. Prophage Series vaccines are currently being studied in both newly diagnosed and recurrent GBM.
From Yahoo!'s Briefing.com newsfeed:
7:01 am Agenus: Positive Phase 2 Results from Agenus' Brain Cancer Vaccine Published in Neuro-Oncology; Results Show Improved Survival Against Aggressive Brain Cancer; More Than 90% of Patients Alive After Six Months (AGEN) : Co announces results published from a Phase 2 study demonstrated that more than 90% of the patients treated with Prophage Series G-200 were alive at six months after surgery and 30% were alive at twelve months. Additionally, the median overall survival was approximately eleven months. This compares favorably to the expected median survival for recurrent Glioblastoma multiforme patients of three to nine months 1-7. The primary objective of this multi-center, single arm Phase 2 trial was to assess the survival rate at six months.
Here is a copy of an October 31, 2013 special email alert where I added significant shares of AGEN to the Explore Portfolio in my newsletter.


Kirk Lindstrom's Investment Letter
Don't Miss Out!
Subscribe Now

Get December Issue for Free!
==>   My returns by year  &  New Record Highs <==
This table shows my newsletter "Core and Explore Portfolios" from 1998 through the end of Q3

End of Day Update for AGEN.  This chart show AGEN tested its Oct/Nov $2.40 low on Friday just before the news today that surged it 31¢.  (Posted 1:55PM PST)

Friday, December 13, 2013

Will Google Build Server Chips & Threaten Intel's Profitable Business?

Today for smart, young adults just out of school Google (GOOGis a great place to work much like HP (HPQ) was 35 years ago when I was hired. Back then, I went to HP to design semiconductors for the Optoelectronic group (OED). HP used its own chips in many of its own products. The group I went to invented the LED for their first calculators  released when I was in high school and the 1977 HP01 watch, released when I was at UC Berkeley studying electrical engineering and computer science.  
These advance products were part of what inspired me to study semiconductor engineering. 
(I get a kick out of how Apple(AAPL), Google and Samsung are still talking about getting regular folks to dress like geeks with wearable computing technology invented by HP and released as a product in 1977!) 

OED grew and spun off OCD (Optical Communication Division) where I designed fiber optic transceivers and later infrared (IrDA) transceivers when Bluetooth and WiFi were still too expensive so the industry used light to communicate wirelessly between devices.
Later chips went into HP computers and later PCs. Eventually, it was not cost effective so we sold the unit (mostly R&D) to Intel. One of my friends and neighbors still works at Intel designing advanced processes. I speculated that this was "cyclical" and eventually some companies would want more control of the chips and not rely on Intel or TSMC and bring both design and manufacturing back in house.

From Wall Street Breakfast at Seeking Alpha:

Intel threatened as Google mulls creating own server chips. Google ( GOOG) is reportedly thinking about designing its own server processors using technology from ARM Holdings ( ARMH). The idea is that with its own chips, Google could better manage the interaction between hardware and software. The move could hurt Intel ( INTC), which earns over 4% of its revenue from the search giant, and which has a 95% share of the market for server chips that use PC processors.
It is interesting that Google is now so big that they are contemplating doing their own chips. Will they also build their own fabs or have UMC, TSMC, Samsung or even Intel build the chips for them?


Kirk Lindstrom's Investment Letter
Don't Miss Out!
Subscribe Now

Get December Issue for Free!
==>   My returns by year  &  New Record Highs <==
This table shows my newsletter "Core and Explore Portfolios" from 1998 through the end of Q3


Thursday, December 05, 2013

AAII Bull Bear Sentiment Graph

AAII Bulls Minus Bears vs DJIA Survey Data and Graph for 12/5/2013
The AAII Investor Sentiment Survey measures the percentage of individual investors who are bullish, bearish, and neutral on the stock market for the next six months. AAII is the "American Association of Individual Investors." For the survey, Individual members of the AAII are polled on a weekly basis. Only one vote per member is accepted in each weekly voting period. The AAII reports the weekly results at http://www.aaii.com/sentimentsurvey/.
As of 12/04/13, the AAII members are:
  • Bullish: 42.64%
  • Neutral: 29.81%
  • Bearish: 27.55%
This chart shows the 52-week moving average of the AAII bull/bear index (American Association of Individual Investors). 52 weeks removes seasonality from the number and gives startling results.

Charts of the AAII (American Association of Individual Investors) Bulls minus Bears Index versus the market are key sentiment indicators for stock market technical analysis.  Contrarian theory states the time to buy is when fear and pessimism are at a maximum since this usually occurs near market bottoms.


More Information
Kirk Lindstrom's Investment Letter
==>   My returns by year  &  New Record Highs <==
 This table shows my newsletter "Core and Explore Portfolios" from 1998 through the end of Q3
Don't Miss Out!
Subscribe Now

Get December Issue for Free!


Tuesday, December 03, 2013

Dow Jones Economic Sentiment Indicator vs S&P500

Today the Wall Street Journal released their monthly reading of the DJ Economic Sentiment Index.  Below is my graph showing a plot of the Dow Jones Economic Sentiment Indicator versus the S&P500.
DJ Economic Sentiment Index Rises to 51.5 in November   
The U.S. economy in November showed few negative signs from the government shutdown that occurred in October, according to a survey of newspaper stories on U.S. economic activity released Monday.
 “The ESI has been picking up since its modest late-summer pullback, suggesting steady positive momentum in the U.S. economy into the yearend, boding well for the November payrolls report,” says Alen Mattich, “Money Talks” columnist at Dow Jones Newswires. 
 “But the positive news doesn’t suggest the sort of economic strength that would make the Federal Reserve hurry to trim its asset purchase program,” Mr. Mattich said.

Here is another very interesting chart:


About the DJ Economic Sentiment Index:

The economic sentiment indicator is designed to project the health of the U.S. economy by analyzing coverage of 15 major American newspapers, using a proprietary algorithm to look for positive and negative sentiment about the economy in every article.

The ESI is reported on a scale of 0 to 100; higher numbers represent increasingly positive sentiment. Dow Jones selected the 15 newspapers used to compile the indicator because they include extensive original reporting on economic issues. They are also geographically diverse and represent eight of the 10 largest metropolitan areas in the U.S.


Kirk Lindstrom's Investment Letter
==>   My returns by year  &  New Record Highs <==
 This table shows my newsletter "Core and Explore Portfolios" from 1998 through the end of Q3

Don't Miss Out!
Subscribe Now

Monday, December 02, 2013

PMI Manufacturing Purchasing Managers’ Index at Highest Reading Since January

Markit U.S. Manufacturing Purchasing Managers’ Index (PMI)rose to its highest reading since January 2013

Key points:
  • PMI rebounds to ten-month high, signalling solid improvement in business conditions
  • Output and new order growth accelerates sharply
  • Rate of job creation slows

Commenting on the final PMI data, Chris Williamson, Chief Economist at Markit said:
“The U.S. manufacturing sector has shown surprising resilience in the face of the government shutdown. The average PMI reading so far in the fourth quarter is unchanged on the average seen in the third quarter and the survey is consistent with production growing at an annualised rate of approximately 2.5%.
“Large companies are leading the upturn, having escaped the impact of the shutdown, with output and new orders growth rending higher in recent months. SMEs suffered a bigger shutdown impact, but saw growth rebound again in November. Similarly, while employment rose in SMEs, it is larger firms that are driving job creation.
“One of the most encouraging trends we are seeing, however, is a surge in the production of capital goods such as plant and machinery, which is growing at the fastest rate since the financial crisis, fuelled by rising domestic demand. This is a great sign that companies are feeling sufficiently confident to be boosting investment.” 

From Markit:
The Purchasing Managers’ Index™ (PMI™) is a composite index based on five of the individual indexes with the following weights: New Orders – 0.3, Output – 0.25, Employment – 0.2, Suppliers’ Delivery Times – 0.15, Stocks of Items Purchased – 0.1, with the Delivery Times Index inverted so that it moves in a comparable direction.
Kirk Lindstrom's Investment Letter
 This table shows my newsletter "Core and Explore Portfolios" from 1998 through the end of Q3
Don't Miss Out!
Subscribe Now

and get the November issue for free
(Start subscription with December issue)

Wednesday, November 27, 2013

Gold & GLD Resistance and Support Charts

Charts showing the important resistance and support levels for Gold and its exchange traded fund, GLD.  This morning I sent buy and sell levels for potential GLD trades to my subscribers.  If you would like to get this email, subscribe to my newsletter and I will send it to you.

Gold appears to be testing its 3-year low near the 61.8% Fibonacci retracement of the run from $681 to $1,923.70 per ounce.  
Click images to view full size
If the  61.8% Fibonacci support fails, then the next major support level for gold is the 2008 high of $1,033.90.
This graph shows gold prices for the last three years .  


This graph shows resistance and support levels for GLD, the exchange traded fund for Gold and my first choice as a low cost way to trade gold.
More charts and current quotes:
Don't Miss Out!
Subscribe Now

and get the November issue for free
(Start subscription with December issue)

A Gold Digger

Tuesday, November 26, 2013

Burton Malkiel Asset Allocation Advice

This very interesting article from CNBC "Why traditional diversification is ‘downright dangerous" explains why Nobel Prize winner Burton Malkiel believes that traditional 60:40 stocks:bonds asset allocation is "downright dangerous."

Burton Malkiel is the chief investment officer at Wealthfront, a Princeton professor and author of the investment classic, "A Random Walk Down Wall Street: The Time-Tested Strategy for Successful Investing (Completely Revised and Updated)," a book that helped launch the low-cost index-investing revolution.

Key Points:

"The investor in bonds is, I think, very likely to get badly hurt by sticking with the 60/40."


CNBC: Why did we ever get the 60/40 in the first place?
Malkiel: I don't know. And I don't like any kind of norm, because it depends on so many factors—and your personality.
The correct allocation ought to depend on individual circumstances. It is definitely not the right kind of thing for everybody. What I had in my "Random Walk" for the last several editions is a quite different allocation. You should have more equity orientation. Another rule of thumb: Jack Bogle has often said bonds should be a percentage equal to your age. I don't agree with that, either.
I think that allocation is particularly wrong today because we are in an age of financial repression. ... Europe and Japan are having trouble reining in budget deficits, and we have high debt in the U.S., too. (The governments) are deliberately keeping interest rates down. Even a U.S. bond index fund is not the right thing to do, because BND [Vanguard Total Bond Market ETF] is about two-thirds government or agency bonds.
The investor in bonds is, I think, very likely to get badly hurt by sticking with the 60/40.
CNBC: In the recent editions of "Random Walk," you suggested the following portfolio for an investor in his or her 50s—with each asset class represented by a low-cost fund—and for the percentage allocated to equities to be larger, depending on the age and risk tolerance of the investor:
  • Cash: 5 percent
  • Bonds: 27.5 percent
  • REITs: 12.5 percent
  • Stocks: 55 percent
How would you update that portfolio?
Malkiel: The recent editions were written when bonds had a generous yield. Today BND yields are about 2.4 percent. That is why we suggest the bond (safer) part of the portfolio be fine-tuned. We ... use high-quality dividend growth stocks for a part of what otherwise would be a straight bond portfolio. Also, we use some foreign bonds where debt/GDP is low and yields are relatively high.
The updated portfolio for an investor in his or her 50s would look like:
  • Cash: 5 percent
  • Dividend growth stocks, emerging market bonds and tax-exempt bonds: 27.5 percent
  • REITs: 12.5 percent
  • Stocks: 55 percent
You use that as a starting point and move allocations up or down, depending on your age.
Note that Malkiel doesn't like hedge funds or gold.  CNBC gets a lot of free content from hedge fund managers hoping the exposure will convince some watching to look them up and ask them to manage money for a 2% annual fee plus 20% of any gains, called "2 and 20" or "2.20" by Malkiel.

CNBC: How has your view of asset allocation changed over the years?
Malkiel: I'm more open to the idea that you need stability. You may not, as an individual, just be psychologically able to stand the amount of volatility that equities have. You want a little more stability. ... I can understand that. It depends on your ability to not go crazy and sell at the wrong time when the equities drop, as they do.
I'd like to broaden the definition of how you get the stability. It's just saying ... in today's world, bonds as the only possibility to add stability to a portfolio is a much too narrow way to look at it, and a suboptimal way.
We're talking about a broader definition of diversification. There are some financial advisors using this window to broaden it to include a lot of alternative asset classes, like gold.
Some are even suggesting hedge funds. I believe in wider diversification, but for me wider diversification would be to look at some emerging markets that are very unpopular. Or REITs. Real estate is a hard asset, good when inflation is low.
Something like a hedge fund that charges 2.20 percent is a sure loser. 
I'm not a big fan of gold. People say it's a hedge against Armageddon. If the world disappears, your asset allocation will be the least of your concerns.
CNBC: What are the criteria you use to judge an asset class?
Malkiel: You want to control the things you can control. Worry very much about the costs you pay. All of us who deal with the stock market need to be very modest about our ability to make money. But the one thing is certain: The lower the fee I pay ... the more there will be for other investments. Worry about taxes on an asset class, fees, and you do want to be diversified. It's a totally reasonable thing to want stability, but it is not clear to me that that means bonds—or U.S. bonds, specifically.
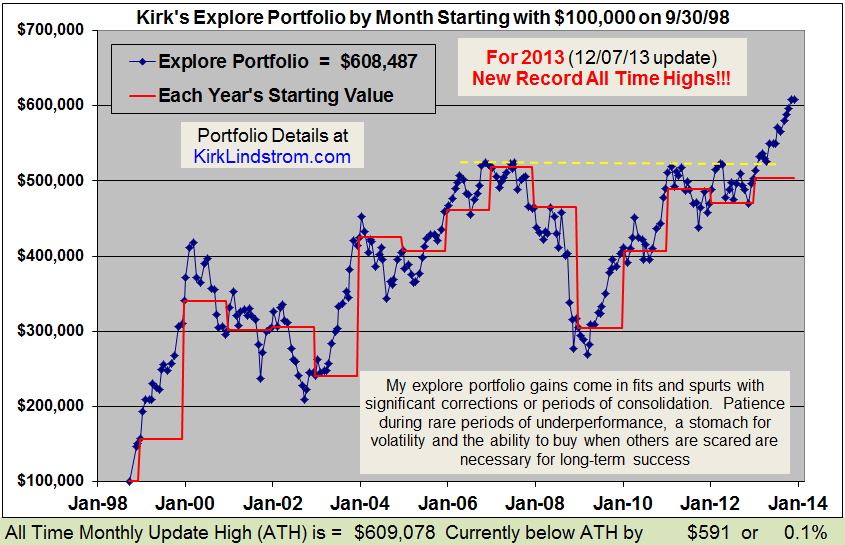
Note:  My "core conservative portfolio" is probably too conservative according to Malkiel with 50% in "fixed income" with none of it currently in bonds and 50% in equities and REITs.  My "aggressive core portfolio" with 20% "fixed income" (none of which are bonds) and "80%" in equity index funds plus a REIT and 20% of the total portfolio in an "explore portfolio" with some bonds fits his model quite well. 
This table shows my newsletter "Core and Explore Portfolios" from 1998 through the end of Q3
Don't Miss Out!
Subscribe Now

and get the November issue for free
(Start subscription with December issue)

State Street Investor Confidence Index vs the Dow

Today, the State Street Investor Confidence Index fell to 91.3 from last month's revised lower reading of 95.5.   
This chart shows the Dow (Dow Jones Industrial Average) plotted against the monthly reading for the State Street Investor Confidence Index.
Click to view full size chart 
According to State Street, "The State Street Investor Confidence Index® measures confidence directly and quantitatively by assessing the changes in investor holdings of equities, implementing a model developed by State Street Global Markets’ research partnership, State Street Associates. The more of their portfolio that institutional investors are willing to devote to equities, the greater the risk appetite or confidence."


This table shows my newsletter "Core and Explore Portfolios" from 1998 through the end of Q3
Don't Miss Out!
Subscribe Now
and get the November issue for free
(Start subscription with December issue)

Thursday, November 21, 2013

Investors Intelligence Sentiment vs S&P500

Investors Intelligence Survey Data of Bulls-Bears vs. Weekly S&P500

The “Investors Intelligence Survey“ or IIS is one of the oldest weekly sentiment indicators used today. Charts of the Investors’ Intelligence Survey (IIS) “Bulls over Bulls plus Bears” versus the market are key tools for stock market technical analysis or sentiment. The IIS began in January 1963 by A.W. Cohen and has been published every week ever since.


Chart of Investors Intelligence Sentiment Survey

Bulls / (Bulls+Bears) vs S&P500
Click to view full sized

More info at Investors' Intelligence Sentiment Indicator

This table shows my newsletter "Core and Explore Portfolios" from 1998 through the end of Q3
Don't Miss Out!
Subscribe Now

and get the November issue for free
(Start subscription with December issue)

Graph 10 & 30-Yr T-Bonds vs S&P500

This graph shows ten and thirty year US Treasury Bond rates versus the S&P500 from 1995 to today.
Click for full size image

For current quotes and charts, see: 
This table shows my newsletter "Core and Explore Portfolios" from 1998 through the end of Q3
Don't Miss Out!
Subscribe Now

and get the November issue for free
(Start subscription with December issue)


Followers - Click "follow" to get an email alert for new articles

Kirk Lindstrom's Investment Letter Performance