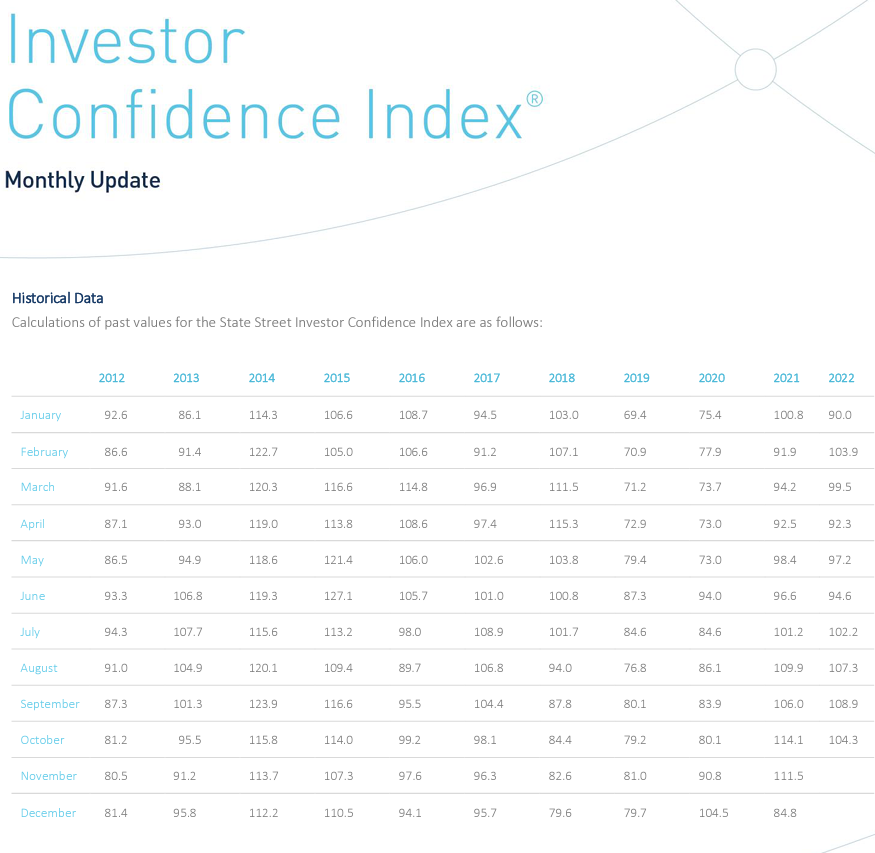
Don't Miss Out On Great Gains! - Best Investment Newsletter


Click for FREE sample of Kirk Lindstrom's Investment Letter

Don't miss out! Subscribe Now

google.com, pub-7001134751860982, DIRECT, f08c47fec0942fa0

Search For More

Thursday, October 27, 2022

Kirk Lindstrom's Investor Sentiment Charts

 ๐Ÿ‚๐Ÿ“ˆKirk Lindstrom's Investor Bull/Bear Sentiment Charts for 10/27/22 ๐Ÿ“‰๐Ÿป

Reminder, you can subscribe or follow this feed and get sent emails by Google when I post new charts and articles.

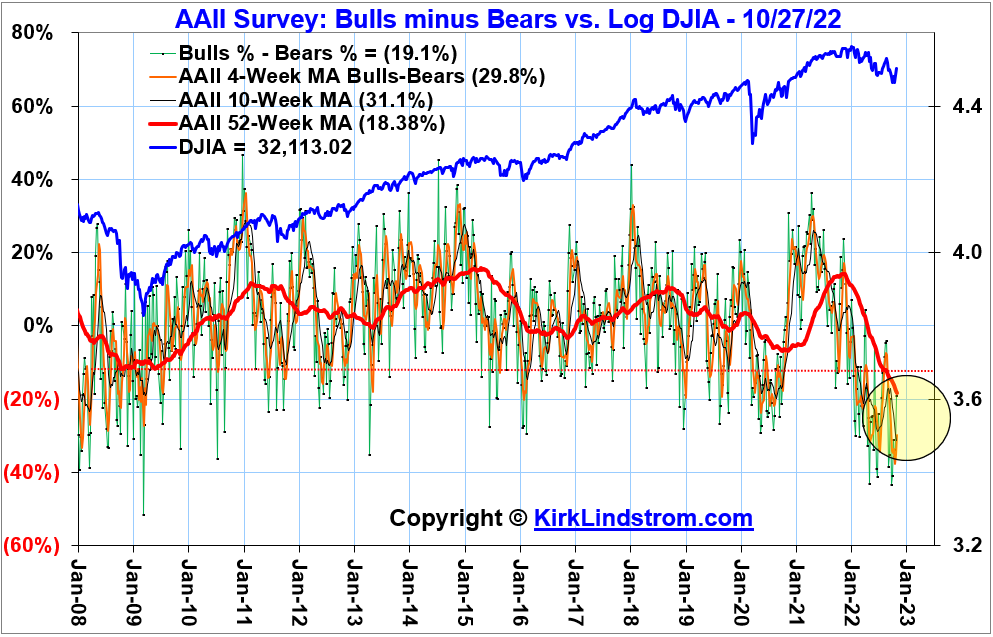
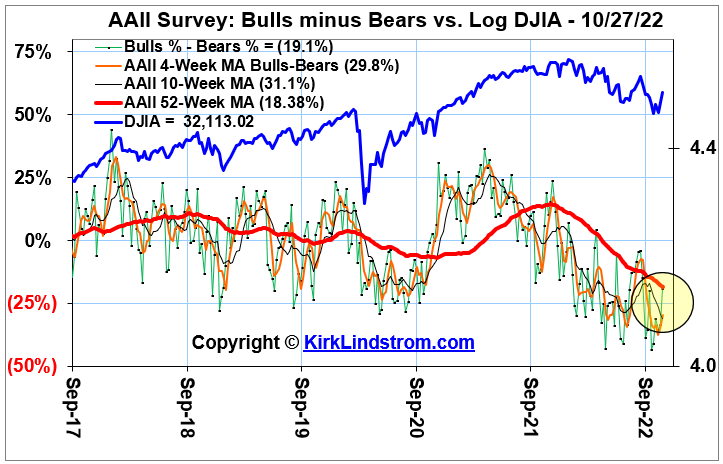
Graph of the American Association of Individual Investors (AAII) Bulls Minus Bears Sentiment Indicator vs the Dow.  


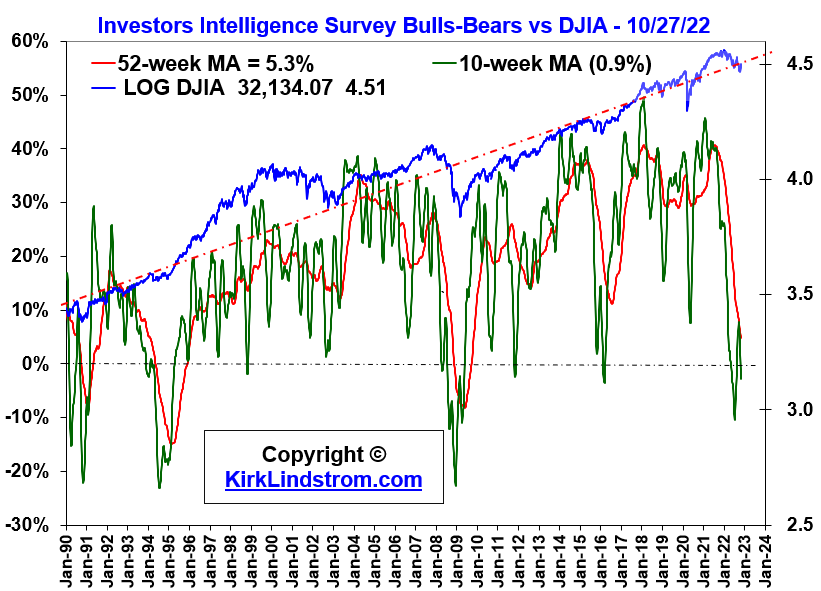
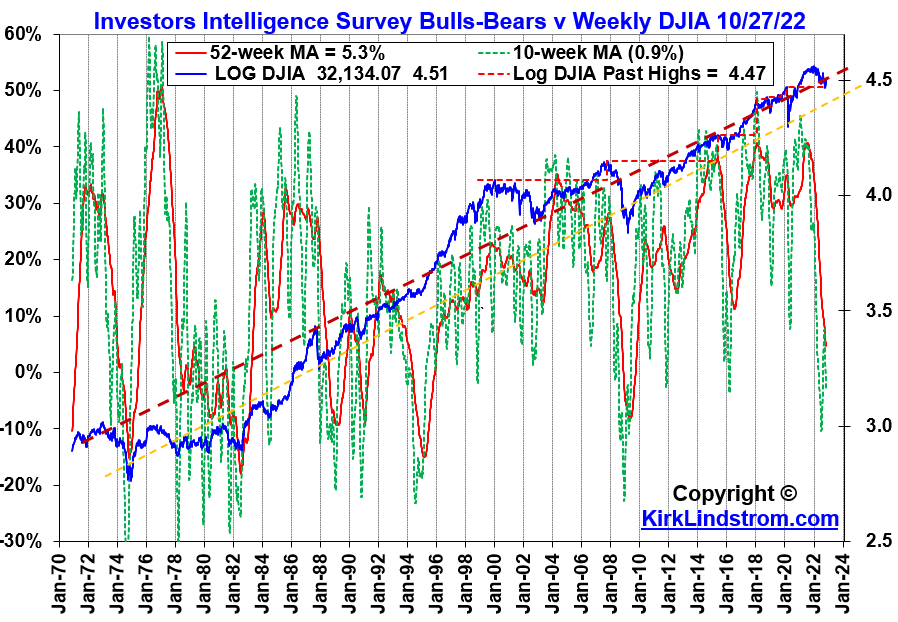
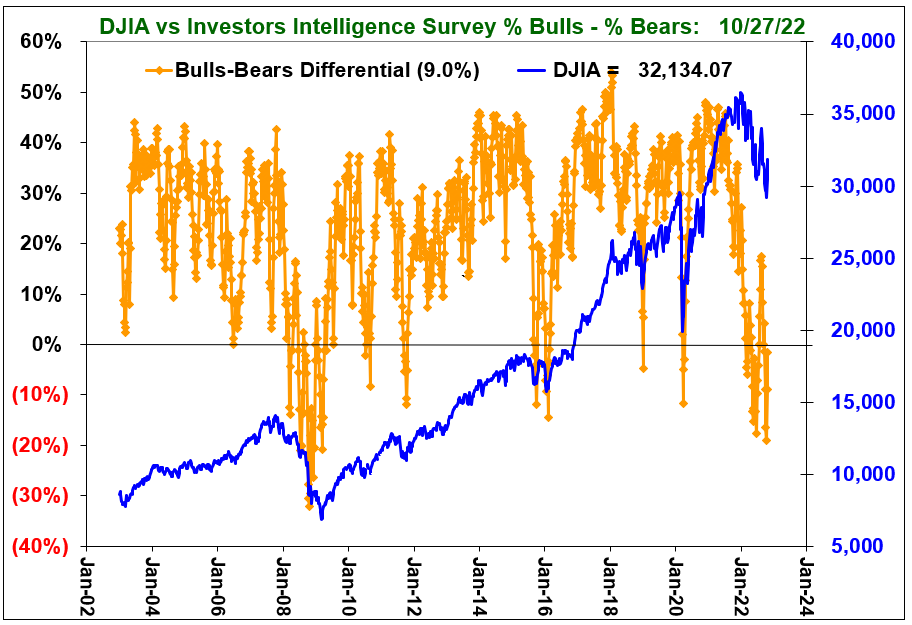
 Graph of the II, Investors Intelligence, Bulls and Bears Survey vs Log Dow Graphs  


Graphs of the "State Street Investor Confidence Index" vs the Stock Markets


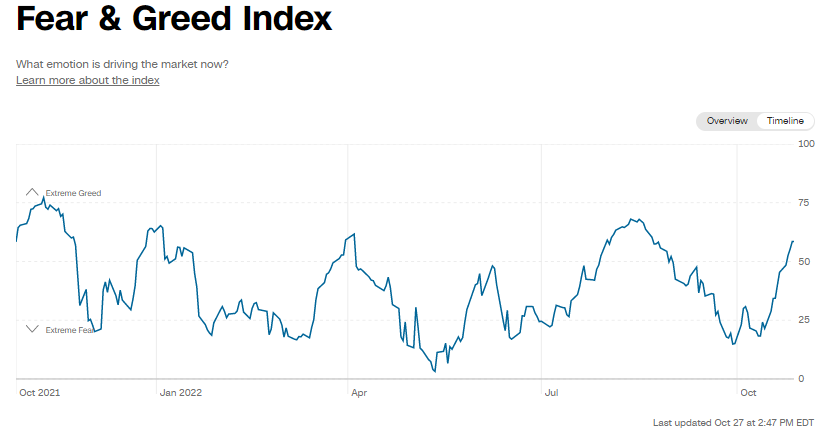
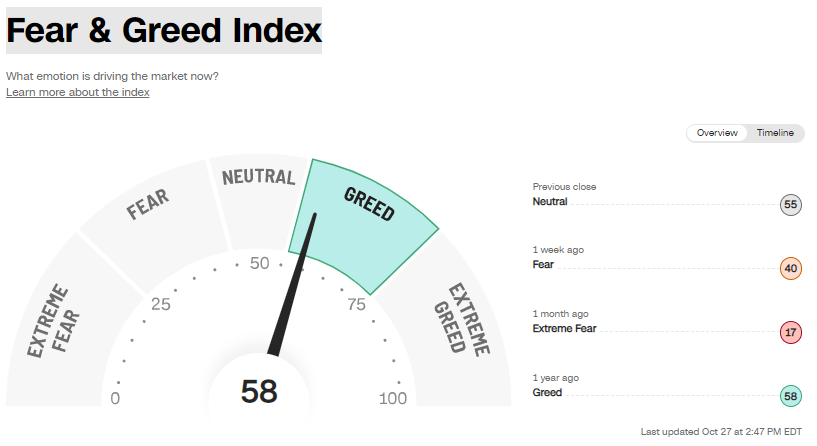
CNN's Fear & Greed Index
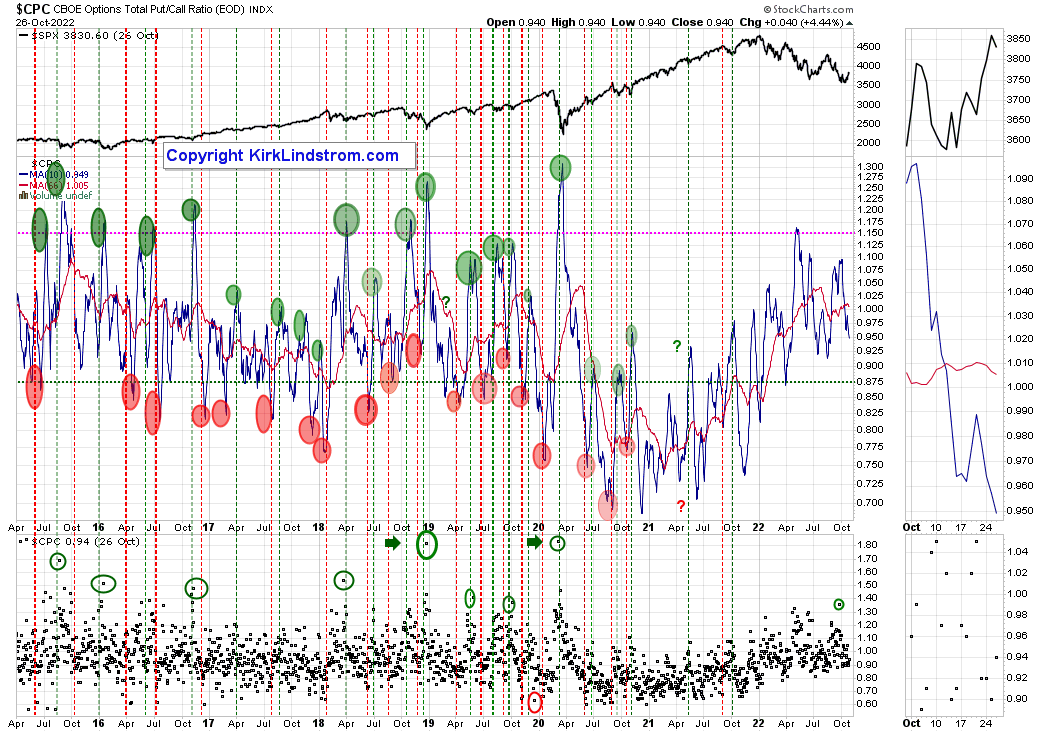


CPC Put Call Ratio


Dow vs Oscillators 


Kirk Lindstrom's Investment Letter

To see what stocks and ETFs are on my buy list and what are my price targets:
 Subscribe NOW  and get
the
 October 2022 
Issue for FREE!!
(If you mention this ad)
๐Ÿป๐Ÿ“‰Kirk Lindstrom's Bull and Bear Sentiment Charts๐Ÿ‚๐Ÿ“ˆ

Next Article: 

The Biden Barometer - Key Financial Markets Under President Biden

Friday, October 21, 2022

2022 Treasury Deficit Adds 1.4 Trillion Dollars - National Debt at $31.2 Trillion

I updated my revenue, spending & deficit table for the US Treasury.  Clearly tax collections continue to rise despite the lower corporate tax rate.  

  • The "problem" is SPENDING has gone up much faster than revenue.   
  • During fiscal 2022, total US Treasury revenue grew 21.0% to $4.9 trillion while spending fell only 8.0% to $6.3 trillion thus adding another $1.4 trillion to the deficit.   
  • The largest Outlay for September was for $449 billion for "Education" with Medicare and Social Security tying for 2nd and 3rd at "only" $104 billion each.   
Spending fell as the government isn't paying workers to not work and stay home to slow the spread of COVID-19. To get a better idea, below are some comparisons to fiscal year1999 before COVID impacted our economy.

Compare FY 2022 with FY 2019:
  • In FY 2019 before spending on COVID-19, the total deficit for the year was "only" $0.98 trillion, thus the deficit grew 40% while revenue collected from taxes grew!
  • Total Revenue in 2019 was $3.33T and total spending was $4.11T
  • Total Revenue in 2022 was $4.90T and total spending was $6.27T  
  • Between FY 2019 and FY 2022
    • Revenue grew $0.76T or 23%
    • Spending grew $2.16T or 53%


Receipts, Outlays, and Surplus/Deficit for September 2022

Receipts by Source: Outlays by Function:
Figure 2. Cumulative Receipts, Outlays, and Surplus/Deficit through Fiscal Year 2022


Kirk Lindstrom's Investment Letter

To see what stocks and ETFs are on my buy list and what are my price targets:
 Subscribe NOW  and get
the
 October 2022 
Issue for FREE!!!
(If you mention this ad)
US National Debt now exceeds $31 TRILLION dollars or $247,882 per taxpayer and $93,703 per person!  

US Debt table from https://www.usdebtclock.org/

Sunday, October 16, 2022

Worst Inflation in 40 Years - Bear Market Continues

The bear market that began at the start of the year continues with all four major markets I follow down over 20% from their peaks.


It is hard to get excited about the economy when gasoline in CA is over $7 per gallon for regular in many areas with the "cheap stations" in the Silicon Valley over $6.00 per gallon.


๐ŸŒกCPI up 8.2% in September๐Ÿ“ˆ๐Ÿ”ฅ


Kirk Lindstrom's Investment Letter

To see what stocks and ETFs are on my buy list and what are my price targets:
 Subscribe NOW  and get
the
 October 2022 
Issue for FREE!!!
(If you mention this ad)

Friday, October 07, 2022

Market Update - The Bear Market Continues

The bear market that began at the start of the year continues with all four major markets I follow down over 20% from their peaks.


Interest rates continue to rise.  Mortgage rates broke above 7% while the 10-year US Treasury, just below 4.0%, is near its high in over a decade.


For many weeks, ECRI"s Weekly Leading Index, WLI, had given some hope as it slowly worked higher, but this week saw the reading for 9/30/22 fall off a cliff on the day the markets made their lows for the year. 
ECRI's WLI, WLI Growth Rate & Quarterly GDP Growth Graph. 
$SPX $SPY $DIA $QQQ


US Stock Markets (Log Scale) vs. Fed Funds Rate 


10-Yr & 30-Yr T-Bond Rates vs S&P 500
 $TNX $TYX $SPX $SPY #InterestRates #Treasury Rates


Kirk Lindstrom's Investment Letter

To see what stocks and ETFs are on my buy list and what are my price targets:
 Subscribe NOW  and get
the
 October 2022 
Issue for FREE!!!
(If you mention this ad)


Sunday, October 02, 2022

US Treasury Interest Rate Graphs

 US Treasury Rates through 9/30/22


TIPS Core Yield vs S&P 500 through 9/30/22

CPI vs Fed Funds Rate vs Expected 10-Yr Inflation - 9/30/22  
10 Year Rates: US vs European & Japan
BND vs SCHZ & AGG
BND - Not adjusted for dividends


Followers - Click "follow" to get an email alert for new articles

Kirk Lindstrom's Investment Letter Performance