Don't Miss Out On Great Gains! - Best Investment Newsletter


Click for FREE sample of Kirk Lindstrom's Investment Letter

Don't miss out! Subscribe Now

google.com, pub-7001134751860982, DIRECT, f08c47fec0942fa0

Search For More

Saturday, April 29, 2023

April Market Update - 2023 is 33% Over

 Market Update for April 28, 2023 the last trading day of April.


US Treasury Interest Rates through 4/28/23    


CPI vs Fed Funds Rate vs Expected 10-Yr Inflation 


To see what stocks and ETFs are on my buy list and what are my price targets:
 Subscribe NOW  and get
the
 April 2023 
Issue for FREE!!!
(If you mention this ad)


More Charts of note


xxx

Friday, April 28, 2023

Michigan Consumer Sentiment Index 10 & 50-Year Graphs

University of Michigan Index of Consumer Sentiment

Here is a graph of the  University of Michigan Index of Consumer Sentiment for the last 50 years.


Here is a graph of the  University of Michigan Index of Consumer Sentiment for the last 10 years.


Here is a graph of the  University of Michigan Index of Consumer Sentiment vs the S&P 500 and Nasdaq back to 1990.


To see what stocks and ETFs are on my buy list and what are my price targets:
 Subscribe NOW  and get
the
 April 2023 
Issue for FREE!!!
(If you mention this ad)


University of Michigan data and graphs from http://www.sca.isr.umich.edu/ 

Thursday, April 27, 2023

State Street Investor Confidence Index Graph vs the Stock Markets

Graphs of State Street Investor Confidence Index vs the S&P 500, Nasdaq & Dow 

Graph of State Street Investor Confidence Index vs the S&P 500 


Graph of State Street Investor Confidence Index vs the Nasdaq

Graph of State Street Investor Confidence Index vs the Dow


To see what stocks and ETFs are on my buy list and what are my price targets:
 Subscribe NOW  and get
the
 April 2023 
Issue for FREE!!!
(If you mention this ad)
More Articles:

xxx

Sunday, April 23, 2023

BBBY RIP - Bed Bath & Beyond Chapter 11 Bankruptcy

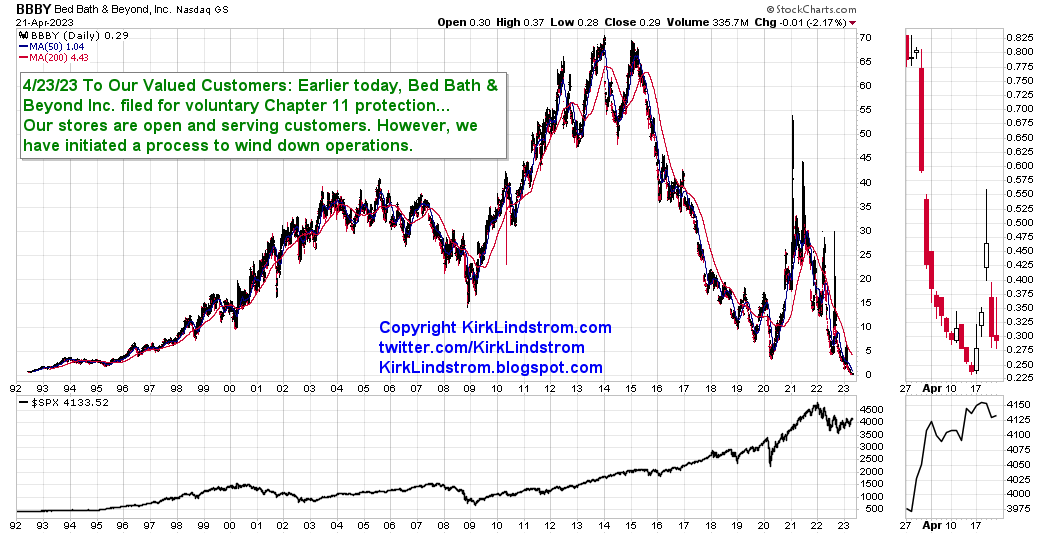
 Today Bed, Bath & Beyond announced Chapter 11 bankruptcy.


To me, a customer, via email dated 4:39 AM PST

To Our Valued Customers:

Earlier today, Bed Bath & Beyond Inc. filed for voluntary Chapter 11 protection.

We appreciate that our customers have trusted us through the most important milestones in their lives – from going to college, to getting married, to settling into a new home, to having a baby – and we wanted to reach out to you to explain what this means.

Our stores are open and serving customers. However, we have initiated a process to wind down operations.

What This Means for Our Customers

We wanted to make you aware that several of our programs and policies may be changing soon. As of today:

• We expect to process returns and exchanges in accordance with our usual policies until May 24, 2023, for items purchased prior to April 23, 2023

• We expect Gift Cards, Gift Certificates, and Loyalty Certificates will be accepted through May 8, 2023

• We will no longer accept coupons or Welcome Rewards+ discounts beginning April 26, 2023

• We expect all in-stock orders placed online both prior and after our bankruptcy filing to be fulfilled at this time
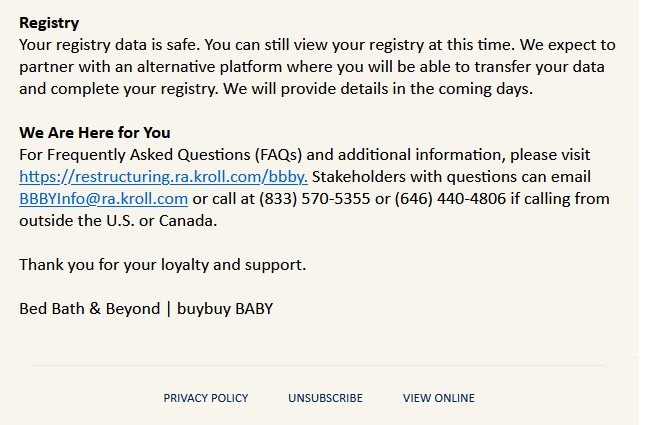
Registry

Your registry data is safe. You can still view your registry at this time. We expect to partner with an alternative platform where you will be able to transfer your data and complete your registry. We will provide details in the coming days.

We Are Here for You

For Frequently Asked Questions (FAQs) and additional information, please visit

https://restructuring.ra.kroll.com/bbby. Stakeholders with questions can email

BBBYInfo@ra.kroll.com or call at (833) 570-5355 or (646) 440-4806 if calling from outside the U.S. or Canada.

Thank you for your loyalty and support.

Bed Bath & Beyond | buybuy BABY

Wednesday, April 12, 2023

Treasury Revenue Falls For Fifth Consecutive Month

I updated my revenue, spending & deficit table for the US Treasury with the latest numbers.

  • Revenue (taxes and fees) is not keeping up with inflation much less growing as you would expect if the economy was healthy
  • Spending is soaring, much like a recession.
  • Deficits, as a result, have already soared to $1.1 Trillion at the half way mark of fiscal 2023 while they didn't pass $1 trillion until the 12 month of fiscal 2022.
Clearly, with five months of declining treasury revenue which is mostly individual and payroll taxes, we are in a tax recession already.

With requirements for "Estimated Tax Payments" to be paid four times a year, this is usually a very "lumpy" series thus I add calculations to show how these data change for the same period in the prior year.  For example, April 2022 saw revenue increase by 96.6% as many tax payers paid their capital gains taxes on their fantastic 2021 gains.  What I look for is trends such as the current trend of Treasury Revenue falling month-over-month for five consecutive months despite inflation of over 5% during that period.  If we were to adjust the March 2023 reading by March's 5.0% inflation, "real revenue" collected by the Treasury fell by 5.6% which is hardly a healthy economy.


A healthy, growing US economy should have this revenue moving higher to match GDP growth, which is inflation adjusted, plus inflation. 


Selected excerpts from the Monthly Treasury Statement

Cumulative Receipts, Outlays, and Surplus/Deficit through Fiscal Year 2023


Note how this next graphic shows the March 2023 deficit is already larger than the August 2022 deficit:

Kirk Lindstrom's Investment Letter

To see what stocks and ETFs are on my buy list and what are my price targets:
 Subscribe NOW  and get
the
 April 2023 
Issue for FREE!!!
(If you mention this ad)

xxx

Saturday, April 01, 2023

The Stock Markets Soared in Q1-2023!

 📈🐂Market Update for Friday March 31, 2023🐻📉

The Dow, SPX, Nasdaq & Russell 2000 gained 0.4%, 7.0%, 16.8% and 2.3%, respectively.

Buffett's Berk/B fell 0.1%!

BRK/B is Warren Buffett's Berkshire Hathaway Class B Shares


DJIA  Dow Jones Industrial Average

S&P 500

Nasdaq

IWM is iShares Russell 2000 ETF

Interesting return data from a Ryan Detrick tweet
"This is interesting.

When the S&P 500 gained >7% in Q1, the full year has never been lower.

That is 16 out of 16 times the full year finished in the green, up 23.1% on avg."

I asked Ryan,
"What does the data look like if you use 6.0% or even 6.5%.  Perhaps a nit, but this data is really for returns of 8.0% or higher."
II Sentiment : Bulls / (Bulls+Bears) vs S&P 500 - 1998 to Now 


To see what stocks and ETFs are in my "Explore Portfolio" and get a full list of on my price targets to both take profits or buy more:
 Subscribe NOW  and get
the
 March 2023 
Issue for FREE!!
(If you mention this ad)
Reminder, you can subscribe to this feed for free to get sent emails by Google when I post new charts and articles. Just click "Follow" below.
x

Followers - Click "follow" to get an email alert for new articles

Kirk Lindstrom's Investment Letter Performance