Don't Miss Out On Great Gains! - Best Investment Newsletter


Click for FREE sample of Kirk Lindstrom's Investment Letter

Don't miss out! Subscribe Now

google.com, pub-7001134751860982, DIRECT, f08c47fec0942fa0

Search For More

Monday, January 31, 2022

2021 US Federal Tax Rates and Brackets

 The tax brackets were updated this year, so your income may be taxed at a different rate than last year. Here are the updated brackets:

2021 tax rates:

If your filing status is Single:

2021 Income:

$0 - $9,950 = 10%
(Up $250 or 2.58% from $0 - $9,700 last year.  See below for other 2020 rates and brackets)

$9,951 - $40,525 = 12%

$40,526 - $86,375 = 22%

$86,376 - $164,925 = 24%

$164,926 - $209,425 = 32%

$209,426 - $523,600 = 35%

$523,601 and over = 37%
(Up $13,300 or 2.58%  from  $510,301 and over last year)


See below for 2019 & 2020 tax rates and brackets

If your filing status is Married Filing Jointly (MFJ) or Qualifying Widow(er):

2021 Income:

$0 - $19,900 = 10%

$19,901 - $81,050 = 12%

$81,051 - $172,750 = 22%

$172,751 - $329,850 = 24%

$329,851 - $418,850 = 32%

$418,851 - $628,300 = 35%

$628,301 and over = 37%


If your filing status is Married Filing Separately (MFS):

2021 Income:

$0 - $9,950 = 10%

$9,951 - $40,525 = 12%

$40,526 - $86,375 = 22%

$86,376 - $164,925 = 24%

$164,926 - $209,425 = 32%

$209,426 - $314,150 = 35%

$314,151 and over = 37%


If your filing status is Head of Household (HH):

2021 Income:

$0 - $14,200 = 10%

$14,201 - $54,200 = 12%

$54,201 - $86,350 = 22%

$86,351 - $164,900 = 24%

$164,901 - $209,400 = 32%

$209,401 - $523,600 = 35%

$523,601 and over = 37%


2020 tax rates:

If your filing status is Single:

Income

$0 - $9,950 = 10%

$9,951 - $40,525 = 12%

$40,526 - $86,375 = 22%

$86,376 - $164,925 = 24%

$164,926 - $209,425 = 32%

$209,426 - $523,600 = 35%

$523,601 and over = 37%


If your filing status is Married Filing Jointly (MFJ) or Qualifying Widow(er):

Income

$0 - $19,900 = 10%

$19,901 - $81,050 = 12%

$81,051 - $172,750 = 22%

$172,751 - $329,850 = 24%

$329,851 - $418,850 = 32%

$418,851 - $628,300 = 35%

$628,301 and over = 37%


If your filing status is Married Filing Separately (MFS):

Income

$0 - $9,950 = 10%

$9,951 - $40,525 = 12%

$40,526 - $86,375 = 22%

$86,376 - $164,925 = 24%

$164,926 - $209,425 = 32%

$209,426 - $314,150 = 35%

$314,151 and over = 37%


If your filing status is Head of Household (HH):

Income

$0 - $14,100 = 10%

$14,101 - $53,700 = 12%

$53,701 - $85,500 = 22%

$85,501 - $163,300 = 24%

$163,301 - $207,350 = 32%

$207,350 - $518,400 = 35%

$518,401 and over = 37%


2019 tax rates:

If your filing status is Single:

Income

$0 - $9,700 = 10%

$9,701 - $39,475 = 12%

$39,476 - $84,200 = 22%

$84,201 - $160,725 = 24%

$160,726 - $204,100 = 32%

$204,101 - $510,300 = 35%

$510,301 and over = 37%


If your filing status is Married Filing Jointly (MFJ) or Qualifying Widow(er):

Income

$0 - $19,400 = 10%

$19,401 - $78,950 = 12%

$78,951 - $168,400 = 22%

$168,401 - $321,450 = 24%

$321,451 - $408,200 = 32%

$408,201 - $612,350 = 35%

$612,351 and over = 37%


If your filing status is Married Filing Separately (MFS):

Income

$0 - $9,700 = 10%

$9,701 - $39,475 = 12%

$39,476 - $84,200 = 22%

$84,201 - $160,725 = 24%

$160,726 - $204,100 = 32%

$204,101 - $306,175 = 35%

$306,176 and over = 37%


If your filing status is Head of Household (HH):

Income

$0 - $13,850 = 10%

$13,851 - $52,850 = 12%

$52,851 - $84,200 = 22%

$84,201 - $160,700 = 24%

$160,701 - $204,100 = 32%

$204,101 - $510,300 = 35%

$510,301 and over = 37%


Once we get more info about your income, we'll automatically calculate your rates and apply these changes to your refund.


How do tax brackets work?


Tax brackets show you the tax rate you'll pay on each portion of your income. For instance, as a taxpayer filing Single, the lowest tax rate of 10% is applied to the first $9,950 of your income in 2021. The next chunk of your income is then taxed at 12%, and so on, up to the top of your taxable income.

Wednesday, January 26, 2022

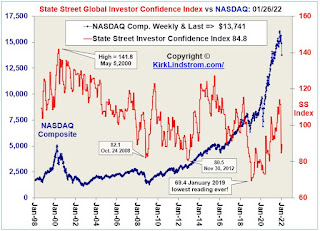
Graphs of State Street Investor Confidence Index vs the S&P 500, Nasdaq & Dow

 Graph of State Street Investor Confidence Index vs the S&P 500, Nasdaq & Dow

Graph of State Street Investor Confidence Index vs the S&P 500

State Street Global Investor Confidence Index vs DJIA 

Graph of State Street Investor Confidence Index vs the Nasdaq $COMPQ

From State Street:
The State Street Investor Confidence Index® (the index) provides an objective, quantitative measure of global risk tolerance of the world’s sophisticated investors. Regional components measure separately the risk appetites of institutional investors in North America, Europe and the Asia-Pacific region.

The Index is released at 10 a.m Eastern Time in the US, on the last Wednesday of each month.

The Premise

Confidence in the economy and the capital markets is a critical driver of economic and financial fluctuations and of the business cycle. When confidence increases, consumers and investors want to buy consumer goods, durables and invest at prevailing prices. When confidence decreases, spending and risk-taking tend to fall.

Investors are said to be confident when the news about the future is good and stock prices are rising. However, rising prices are related both to good fundamentals, such as growth in industrial production and productivity, as well as to the underlying sentiment or mood of investors. A good confidence measure should indicate whether, for a given set of fundamentals, investors have an increased or decreased appetite for risk.

Quantitatively measuring shifts in investor sentiment presents a unique set of problems to researchers. Investor surveys are often outdated by the time they are released. On the institutional side, accuracy can be compromised as decision makers are often too busy to fill out surveys. In all cases, survey responses, like prices, tend to obscure the effects of fundamentals and investor sentiment.

More about Kirk Lindstrom's Investment Letter Service:


Tuesday, January 25, 2022

Wealthy vs Rich - Top 1% & 5% Annual Income Needed by State

The top one percent has a total net worth of $44 million according to the St. Louis Fed. 

 Total Net Worth Held by the Top 1%
(99th to 100th Wealth Percentiles)
(WFRBLT01026)

According to the SmartAsset article "What It Takes to Be in the 1% By State – 2022 Study", 

"An American family needs an income of $597,815 to be considered in the top 1% of earners nationwide. This, however, varies from state to state. In Connecticut, a family needs almost $900,000 in annual income to be in the top 1% of earners in their state, whereas a family in the top 1% of West Virginia needs only an average of just over $350,000"

A VC told me last summer that they have to pay key people poached from Google about one million a year in salary, which I thought was high but sure explains how people can pay $4M to $6M for a home in the more expensive cities here (Atherton, Hillsborough, Palo Alto, Los Altos, Los Altos Hills, Woodside etc. )  Looking at this data, it fits as key people at top companies should be in the top 0.1% of pay.

Here’s how much money you have to earn to be in the top 1% in every US state

#1 Connecticut 

Top 1% income threshold: $896,490Top 5% income threshold: $311,589

#2 Massachusetts

Top 1% income threshold: $810,256Top 5% income threshold: $314,389

#3 New York

Top 1% income threshold: $777,126Top 5% income threshold: $265,530

#4 New Jersey

Top 1% income threshold: $760,462Top 5% income threshold: $308,976

#5 California

Top 1% income threshold: $745,314Top 5% income threshold: $291,277

#6 Washington

Top 1% income threshold: $685,128Top 5% income threshold: $283,574

#7 Colorado

Top 1% income threshold: $632,277Top 5% income threshold: $264,313

#8 Illinois

Top 1% income threshold: $627,329Top 5% income threshold: $250,266

#9 Florida

Top 1% income threshold: $623,736Top 5% income threshold: $223,179

#10 Texas

Top 1% income threshold: $594,313Top 5% income threshold: $237,383

Maryland

Top 1% income threshold: $588,035Top 5% income threshold: $265,100

Virginia

Top 1% income threshold: $584,784Top 5% income threshold: $270,360

Wyoming

Top 1% income threshold: $578,298Top 5% income threshold: $212,937

Minnesota

Top 1% income threshold: $574,780Top 5% income threshold: $243,659

New Hampshire

Top 1% income threshold: $568,731Top 5% income threshold: $254,995

Georgia

Top 1% income threshold: $543,748Top 5% income threshold: $225,232

Pennsylvania

Top 1% income threshold: $541,612Top 5% income threshold: $229,015

North Dakota

Top 1% income threshold: $540,837Top 5% income threshold: $223,203

Nevada

Top 1% income threshold: $540,025Top 5% income threshold: $205,028

Utah

Top 1% income threshold: $528,864Top 5% income threshold: $217,757

Oregon

Top 1% income threshold: $517,607Top 5% income threshold: $228,006

North Carolina

Top 1% income threshold: $506,795Top 5% income threshold: $218,073

South Dakota

Top 1% income threshold: $504,422Top 5% income threshold: $203,185

Arizona

Top 1% income threshold: $503,408Top 5% income threshold: $216,972

Kansas

Top 1% income threshold: $501,009Top 5% income threshold: $213,529

Rhode Island

Top 1% income threshold: $493,748Top 5% income threshold: $220,113

Tennessee

Top 1% income threshold: $492,583Top 5% income threshold: $201,597

Alaska

Top 1% income threshold: $486,671Top 5% income threshold: $230,260

Delaware

Top 1% income threshold: $480,472Top 5% income threshold: $222,092

Nebraska

Top 1% income threshold: $477,312Top 5% income threshold: $207,417

Michigan

Top 1% income threshold: $476,358Top 5% income threshold: $208,693

Wisconsin

Top 1% income threshold: $475,584Top 5% income threshold: $204,669

Louisiana

Top 1% income threshold: $471,506Top 5% income threshold: $199,454

Missouri

Top 1% income threshold: $470,279Top 5% income threshold: $202,054

Oklahoma

Top 1% income threshold: $469,311Top 5% income threshold: $197,397

Montana

Top 1% income threshold: $465,702Top 5% income threshold: $196,629

South Carolina

Top 1% income threshold: $463,976Top 5% income threshold: $202,000

Idaho

Top 1% income threshold: $462,352Top 5% income threshold: $197,850

Ohio

Top 1% income threshold: $460,129Top 5% income threshold: $197,621

Hawaii

Top 1% income threshold: $453,471Top 5% income threshold: $212,622

Vermont

Top 1% income threshold: $451,765Top 5% income threshold: $206,007

Iowa

Top 1% income threshold: $441,223Top 5% income threshold: $202,268

Indiana

Top 1% income threshold: $437,567Top 5% income threshold: $192,928

Maine

Top 1% income threshold: $434,306Top 5% income threshold: $194,663

Alabama

Top 1% income threshold: $432,330Top 5% income threshold: $193,273

Kentucky

Top 1% income threshold: $412,836Top 5% income threshold: $184,217

Arkansas

Top 1% income threshold: $411,633Top 5% income threshold: $183,945

New Mexico

Top 1% income threshold: $384,427Top 5% income threshold: $185,641

Mississippi

Top 1% income threshold: $361,462Top 5% income threshold: $168,705

West Virginia

Top 1% income threshold: $350,212Top 5% income threshold: $171,135

Sources:

Friday, January 21, 2022

Wednesday, January 12, 2022

Kirk's Humane Solution to the Homeless Problem

1/12/22: Modified from my 10/23/21 notes of a post I probably made on Facebook: 

Homeless Solution: Take care of addicts humanly but don't ruin society doing it by continuing to enable bad behavior. 

Build hospital ships where drug and alcohol use is FREE and legal for anyone caught doing it illegally on the streets.  

1,000 Bed Hospital ship USNS Comfort

They can stay on the ships in small rooms and do all the drugs they want and get meals and care for free while having people in their ears suggesting there is a better life.  

Healthy and confined is far better than living in their own feces on the streets. 

When they get healthy on the ships (with proper medication for mental health issues) they may decide being intoxicated and confined is not a good life compared to being free.  

Require those convicted of being intoxicated in public too many times to stay there until they are sober for a six months.  

Fill the hospital ships with workers who want to learn on the job how to care for others as well as recovering addicts to help those who are not sober learn to be sober.  

Eventually you will have people trained to care for our aging population.  Don't let any addicts off the ships into society until they have many months of sobriety and an agreement to take their prescribed medications for mental health issues plus have jobs waiting for them.  

If they can't find a job directly from the ship, have transitional dorm housing where they are paid by the state to care for others in society...  

 STOP ENABLING BAD BEHAVIOR to continue.

Tuesday, January 04, 2022

2021 Performance Results

 2021 Was another great year for the markets and my portfolios.


If following my Explore Portfolio Buys and Sells seems like more work than you have time for, then just follow one of the Core Portfolios that are 100% index funds and should beat 95% of all active managed accounts over time. 

  • Your 1 year, 12 issue subscription will start with next month's issue.
  • Get email alerts when I buy or sell securities for my explore portfolio
  • "Auto Buy" and "Auto Sell" levels set ahead of time for target buy and sell levels for my securities.  This allows you to place "limit orders" with your broker in advance so you can go about your business.
  • All questions about what I write answered by Email.  If what I write is not clear to you, just ask!
  • Only $180 per year via PayPal & $175 if you send a check.

It amazes me how many will pay a "financial advisor" fees as high as 2% a year to buy mutual funds for them (sometimes with high fees kicked back to the advisor) when you can do it yourself for the small cost of my newsletter.  2% a year for $100,000 under management over 10 years adds up.


Followers - Click "follow" to get an email alert for new articles

Kirk Lindstrom's Investment Letter Performance