
🐂📈Kirk Lindstrom's Investor Bull/Bear Sentiment Charts for 11/2/23 📉🐻
Reminder, you can follow this feed (subscribe for free) and get sent emails by Google when I post new charts and articles here. Just click "Follow" below.
11/2/23 Notes:
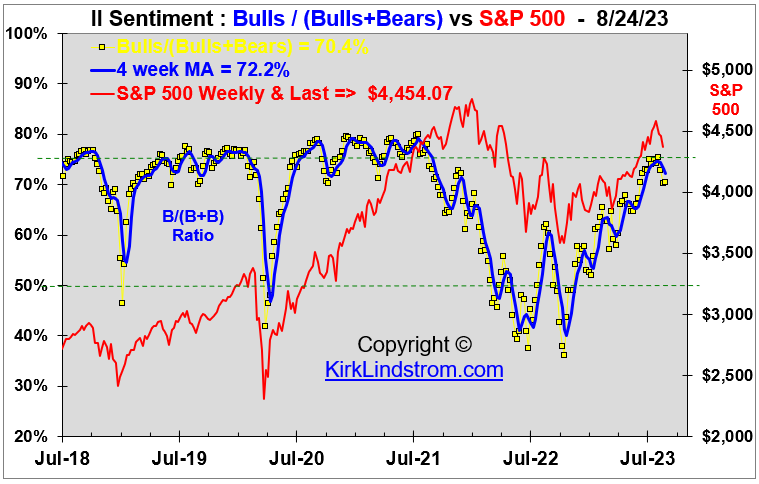
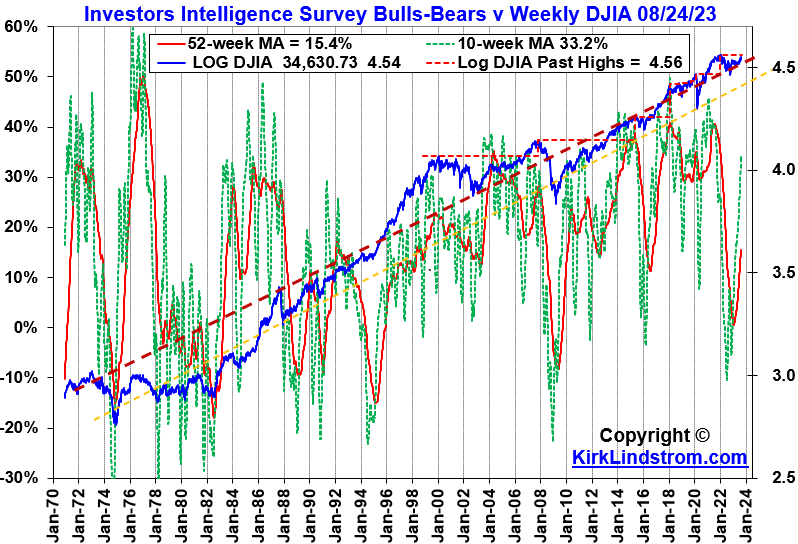
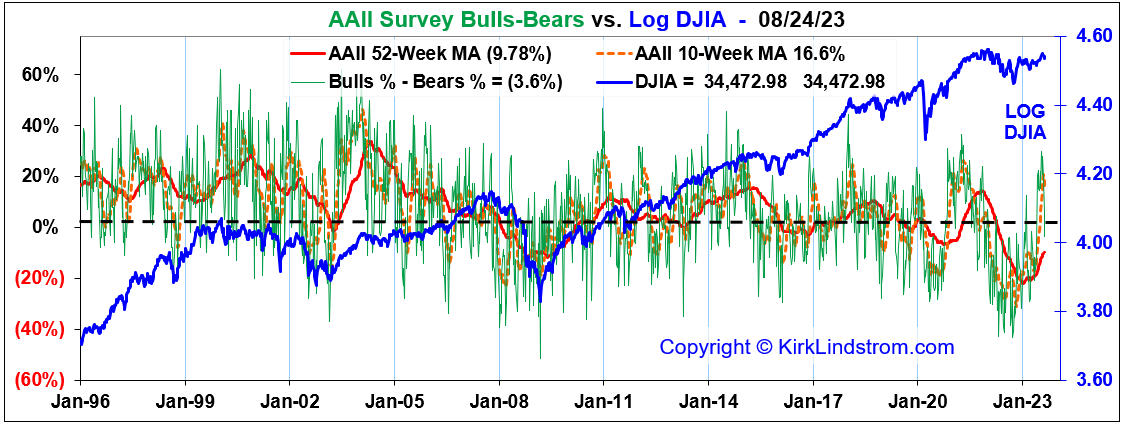
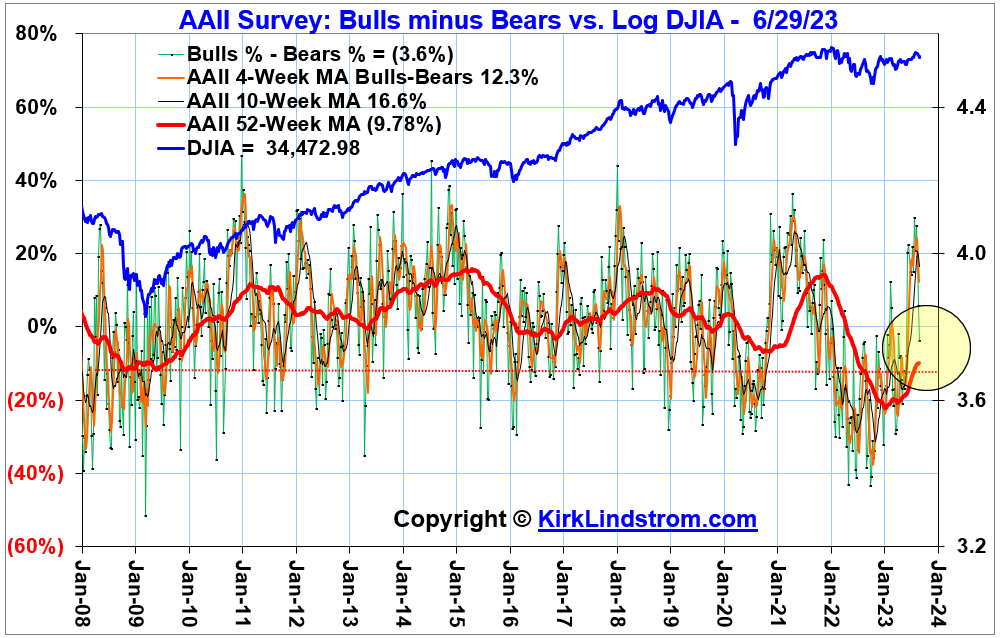
- There is a large divergence between professional newsletter writers (II) and individual investors (AAII) sentiment.
- II is "neutral" but its decline is large enough to support another rally.
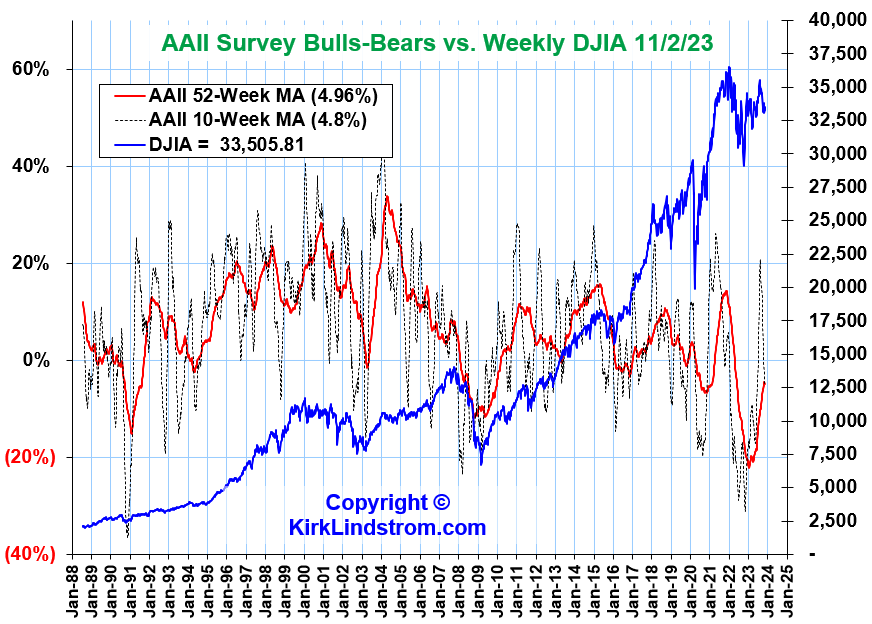
- AAII below negative 20% is bullish for contrarians
Graphs below best viewed in full screen mode.
II Bulls and Bears Sentiment Graphs


AAII Bulls and Bears Sentiment Graphs: The AAII Investor Sentiment Survey measures the percentage of individual investors who are bullish, bearish, and neutral on the stock market for the next six months.


These charts are covered on page 6 of my newsletter with updates during the year for what the different types of sentiment charts mean to me. This is an easy place to give my subscribers updates of charts too numerous to add each month I cover.

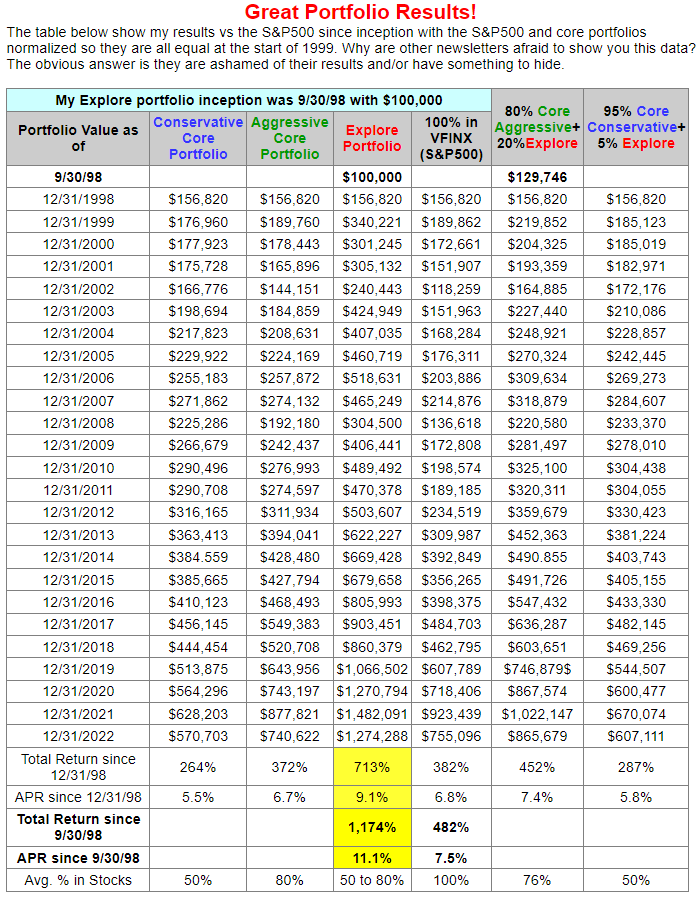
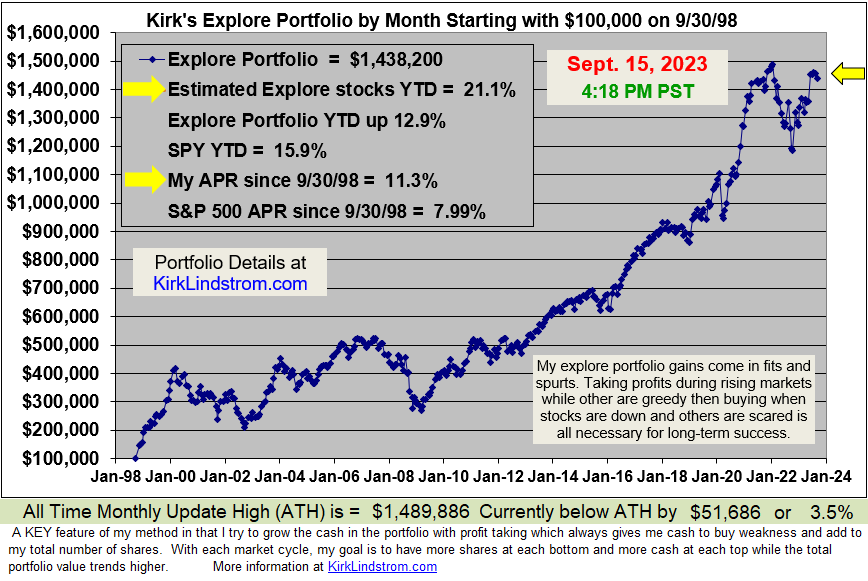
To see what stocks and ETFs are in my "Explore Portfolio" and get a full list of on my price targets to both take profits or buy more:
Subscribe NOW and get
the November 2023 Issue for FREE!!!
(If you mention this ad)
the November 2023 Issue for FREE!!!
(If you mention this ad)


 kirklindstrom.com
