Don't Miss Out On Great Gains! - Best Investment Newsletter


Click for FREE sample of Kirk Lindstrom's Investment Letter

Don't miss out! Subscribe Now

google.com, pub-7001134751860982, DIRECT, f08c47fec0942fa0

Search For More

Thursday, December 27, 2007

More Insider Buying at Jupitermedia Corp. (JUPM)

There was another insider buy reported today at Jupitermedia Corp. (more charts at JUPM).


Click Chart to view full sized chart courtesy of Stockcharts.com

JupiterMedia is not a cheap stock on PE and PEG, but you have to take notice of a stock when insiders keep buying it, especially AFTER it has made a major move from under $1.00 to over $20 before correcting (we hope) to less than $4. Perhaps the very low price/sales and price/book ratio is what has insiders buying?

  • Current Valuation metrics from Yahoo!

    Market Cap (intraday): 134.75M
    Enterprise Value (27-Dec-07): 216.23M
    Trailing P/E (ttm, intraday): N/A
    Forward P/E (fye 31-Dec-08) : 32.42
    PEG Ratio (5 yr expected): 8.48
    Price/Sales (ttm): 1.13
    Price/Book (mrq): 0.66

    Enterprise Value/Revenue (ttm): 1.56
    Enterprise Value/EBITDA (ttm): 8.954
Classification of Insider: Dir/10%/OFCR/ Chair & CEO
Name: Alan Meckler
$15k = Value of I-Buy trade(s)
4.0k = Number of Shares
$3.64 = Average Price Paid
$3.74 = Recent Stock Price (delayed)
112k = Average Daily Volume (composite timeframe)
$131M = Company Market Capitalization
2007-12-24 = Purchase Date
2007-12-27 = Filing Date

Form Four Document (top link on page -- ".html"):
SEC Main Page for Form 4 Filings


Click to view full sized chart courtesy of Stockcharts.com

Insider selling is not nearly as important to monitor as insider buying.

From SEC Form 4 "Explanation of Responses"
1. Mr. Meckler now indirectly owns 3,771,973 shares: 1,328,013 shares held in trusts for the benefit of Mr. Meckler's four children and over which Mr. Meckler exercises investment control, 1,046,125 shares are held in the Alan M. Meckler 2007 Grantor Retained Annuity Trust over which Mr. Meckler exercises investment but not voting control, 953,875 shares are held in the Alan M. Meckler 2007 Grantor Retained Annuity Trust II over which Mr. Meckler exercises investment but not voting control, 259,000 shares donated by Mr. Meckler to the Meckler Foundation, a non-profit charitable foundation founded by Mr. Meckler and for which he acts as a trustee, 11,900 shares purchased by the Meckler Foundation, 114,960 shares purchased by Mr. Meckler's wife and 58,100 shares held in trust for the benefit of Mr. Meckler's mother and over which he exercises investment control.


Other recent Insider buys:


  • 2007-11-26 = Purchase Date
    Dir/10%/OFCR/ Chair & CEO = Classification of Insider
    $35k = Value of I-Buy trade(s)
    10k = Number of Shares
    3.47 = Average Price Paid

  • 2007-11-26 = Purchase Date
    Dir/OFCR/ Pres. & COO = Classification of Insider
    $35k = Value of I-Buy trade(s)
    10k = Number of Shares
    3.47 = Average Price Paid

  • 2007-11-15 = Purchase Date
    Dir/10%/OFCR/ Chair & CEO = Classification of Insider
    $17k = Value of I-Buy trade(s)
    4.6k = Number of Shares
    3.72 = Average Price Paid

  • 2007-11-14 = Purchase Date
    Dir/ = Classification of Insider
    $183k = Value of I-Buy trade(s)
    50k = Number of Shares
    3.69 = Average Price Paid

  • 2007-11-13 = Purchase Date
    Dir/10%/OFCR/ Chair & CEO = Classification of Insider
    $31k = Value of I-Buy trade(s)
    8.1k = Number of Shares
    3.78 = Average Price Paid

Disclaimer. I bought some shares last month at $3.60 after the 11/13 and 11/16 insider buys.

Wednesday, December 26, 2007

Geoglobal Surges on GSPC's Good News from Krishna-Godavari Basin

Today canadian driller Geoglobal Resources (GGR Charts) surged on news from the Krishna-Godavari (KG) Basin. Livemint.com reported GSPC, the Gujarat government-owned hydrocarbon company Gujarat State Petroleum Corp., struck natural gas at two more wells in its Krishna Godavari field in eastern coast of India off Andhra Pradesh. This area is also known as Deendayal block.

Click chart to see full sized version courtesy of stockcharts.com

GSPC has informed the director general of hydrocarbons (DGH), an upstream advisory and technical regulatory body, about the new gas find last week. GSPC managing director D.J. Pandian couldn’t be reached for comment.

The natural gas from KG basin is important for GSPC as it is forced to buy natural gas for its customers from liquefied natural gas (LNG) market at a price of $12-14 (Rs473-552) per million British thermal unit (mBtu) equivalent.

Its existing gas source at Hazira is depleting and GSPC requires its own natural gas source to keep its customer base and grow.

It (GSPC) had announced its biggest ever discovery of 20 trillion cubic feet (tcf) of natural gas from this field at the Deendayal block in mid-2005 but DGH had officially put the reserves figure at 3.6tcf—less than 20% of what GSPC had claimed. Instead of challenging the claim, DGH had asked the corporation to drill more wells to prove its claim of the field having 20 tcf of natural gas.

Striking gas in these two wells would help GSPC prove its claim of higher quantity of natural gas in this field, which it was struggling to do for long,” said a ministry of petroleum and natural gas official who also didn’t want to be named.

GGR has a 5% carried interest in the KG/Deendayal offshore block. GSPC holds 80% of equity in the Deendayal block with 10% held by Jubilant Enpro Ltd, which is part of the Jubilant Corp. (Members of the family that owns Jubilant also have a significant stake in HT Media Ltd, the publisher of Mint where this article came from.)

Disclaimer: I purchased GGR for my newsletter portfolio between $0.94 and $2.25 in 2004 and I have shares purchased as low as 12¢ in my personal portfolio I took quite a bit of profits all the way into the mid teens. I have huge profits in this already. I have been trading the volatility around this core position to generate more gains and may buy or sell at any time. This is a HIGHLY SPECULATIVE stock with no income.

Thursday, December 20, 2007

Finisar CEO Rawls Buys 100,000 Shares at $1.43


Finisar Corp. (More FNSR Charts) CEO, Jerry Rawls, bought 100,000 shares of Finisar stock in the open market on 12/17 and 12/18 at an average price of $1.43 per share.

According to the SEC filing and Yahoo!, this brings his stake (Note 1) to 2,876,203 shares.

On December 14, 2007, two other Finisar insiders purchased 10,000 shares each.
  • Joseph A Young added 10,000 shares at $1.43 per share. This follows non open market purchases on June 15, 2006 of 5,434 shares at $1.96 per share ($10,650) and 5,434 more shares at $2.02 per share ($11,000)
  • Anders Olsson added 10,000 shares at $1.48 per share ($14,800) after selling 20,000 shares in July 2006 at $3.27 per share (Proceeds of $65,400 nice trading!)

About Finisar

Finisar Corporation (NASDAQ: FNSR) is a global technology leader for fiber optic components and subsystems and network test and monitoring systems. These products enable high-speed voice, video and data communications for networking, storage and wireless applications over Local Area Networks (LANs), Storage Area Networks (SANs), and Metropolitan Area Networks (MANs) using Ethernet, Fibre Channel, IP, SAS, SATA and SONET/SDH protocols. The Company is headquartered in Sunnyvale, California, USA. More information can be found at http://www.finisar.com/ and "Kirk's Investment Newsletter."

1. Shares are held by the Rawls Family, L.P. Mr. Rawls is the president of the Rawls Management Corporation, which is the general partner of the Rawls Family, L.P.

Subscribe to Kirk's Investment Newsletter today to get my current outlook for FederFinsar including target prices for 2008 and 2009.

Disclaimer: I own FNSR in my personal and newsletter portfolios. I may trade around a core position at any time.

FDX: FedEx Revenue Grows but Earnings Down on Higher Fuel Costs

Today Memphis based Federal Express (FDX: more charts) reported lower earings per share on higher revenue compared to a year ago due to higher fuel costs.


FedEx reported $1.54 per share which was $0.04 better than average analyst estimates and at the high end of their own November estimate of $1.45 to $1.55 per share.

High fuel prices and weak U.S. economic growth year over year have impacted our business,” said Frederick W. Smith, FedEx Corp. chairman, president and chief executive officer. “We continue to benefit from solid international growth, which helps mitigate softness in U.S. industrial production. While we see challenging near-term economic trends, we remain confident about long-term prospects in all our business segments.”

FedEx Corp. reported the following consolidated results for the second quarter:

  • Revenue of $9.45 billion, up 6% from $8.93 billion the previous year
  • Operating income of $783 million, down 7% from $839 million a year ago
  • Operating margin of 8.3%, down from 9.4% the previous year
  • Net income of $479 million, down 6% from last year’s $511 million

FedEx provided the following outlook:

  • Q3 EPS of 1.15 to $1.30 per diluted share compared to $1.35 a year ago
  • For the full fiscal year ending May 2008, EPS of $6.40 to $6.70 per diluted share.

As of 12/17/07, analysts had estimated FY2008 earnings to be $6.28 to $6.76 so this is nice upgrade.

Charts courtesy of stockcharts.com

Subscribe to Kirk's Investment Newsletter today to get my current outlook for Federal Express including target prices for 2008 and 2009.

Disclaimer: I own FDX in my personal and newsletter portfolios with gains over 100% in both. I may trade around a core position at any time.

Thursday, December 13, 2007

Finisar Up After Regaining NASDAQ Listing Compliance

Finisar (more FNSR Charts) Regains Compliance With Nasdaq Listing Requirements

SUNNYVALE, CA, Dec 10, 2007 (Web Site Press Release) -- Finisar Corporation (NASDAQ: FNSR), a technology leader in gigabit fiber optic solutions for high-speed data networks, today announced it had received confirmation that the Nasdaq Listing and Hearing Council has determined that, with the filing of its previously delayed annual report on Form 10-K and quarterly reports on Form 10-Q on December 4, 2007, Finisar has demonstrated compliance with Nasdaq's filing requirements under its Marketplace Rules. Accordingly, Finisar's common stock will continue to be listed on The Nasdaq Global Select Market.

About Finisar

Finisar Corporation (NASDAQ: FNSR) is a global technology leader for fiber optic components and subsystems and network test and monitoring systems. These products enable high-speed voice, video and data communications for networking, storage and wireless applications over Local Area Networks (LANs), Storage Area Networks (SANs), and Metropolitan Area Networks (MANs) using Ethernet, Fibre Channel, IP, SAS, SATA and SONET/SDH protocols. The Company is headquartered in Sunnyvale, California, USA. More information can be found at http://www.finisar.com/ and "Kirk's Investment Newsletter."


Subscribe to Kirk's Investment Newsletter today to get my current outlook for Finisar including buy and sell levels to trade around a core position.

Monday, December 10, 2007

Sub-prime Meltdown Crisis Explained

In the "funny but true" category, this is an exceptional (and most hilarious) explanation of the sub-prime financial crisis.

"Rewarding the Ingenuity of the Markets"

Question: "Isn't that rewarding greed and stupidity?"

Answer: "No, no. It is rewarding.... the ingenuity of the markets."

"We want this money to .... so we can continue to lend money as if nothing happened without thinking too much about it."

Request Invitation to FREE facebook discussion group "Investing for the Long Term."


Q: "If you don't get this money, what then?"

A: "Well then there would be another market crash. Then we would say what we always say. It is not us that will suffer, it is your pension fund."

CD Rate Survey

The best rate is 5.45% at Countrywide Bank for 3 months

1 and 2 yrs: 5.21% at Apple Bank for Savings

3 yrs: 5.00% at Capital One Bank & Flagstar Bank

5 yrs: 5.26% at Apple Bank for Savings

7 & 10 yrs: 5.10% at Capital One Bank

From the Highest CD Rates survey at forbestadvice.com

Friday, December 07, 2007

How Do You Asset Allocate Across Different Accounts?

"I am sure most of you have multiple accounts, how do you deal with this issue?"

From our forum "Novice Corner - A place to learn and help others" in the facebook group "Investing for the Long Term."

JG Singh asked:

My question is regarding diversifying or balancing my portfolio.

I have two 401k accounts, 2 IRAs, 2 rothIRAs and a trading account. I have noticed that I have been diversifying and balancing each account on its own resulting in too many positions and more diversification than probably needed. As a result I move with S&P. (altough I am recovering faster than S&P since last week)

What should my approach be? should I be diversified overall (in combined portfolio) or should I worry about diversifying them individually?

I am sure most of you have multiple accounts, how do you deal with this issue?

My reply:

I not only have multiple accounts, but multiple strategies as I experiment with new ideas. I believe in diversification of strategies not just asset classes so I have some "buckets of money" that follow my explore portfolio, some that follow index investing and some that I use to "wing it."

The most important thing to do is put it all on a single spreadsheet where you track your overall asset allocation. It doesn't matter if you have my free portfolio that consists of 120 less your age in equities (VTSMX) with the remainder in Total Bond (VBMFX) or the 7 Vanguard Index Fund core portfolio I recommend in my newsletter mixed with 16 stocks from my explore portfolio and 100 stocks and funds you've accumulated over the years. You want to start with EVERYTHING on a single spreadsheet to see where you are.

The hardest part with putting it all on a single spreadsheet is figuring out how your managed mutual funds are allocated. Mutual funds often have “style drift” where they might start out as a small cap US fund, do great for 10 or 20 years then drift into international and large cap funds as they try to invest the money that keeps flowing in. I’ve owned Fidelities fantastic Contra and Low Priced Stock funds for a long time and they have crushed the S&P500.

Chart of relative performance

Click to see full sized chart courtesy of stockcharts.com

As you can see from the links, FLPSX has drifted to a “mid-cap blend” whereas I bought it in 1998 when it was a small cap value fund. I bought FLPSX to diversify from my small and large cap growth stocks that I made a small fortune on in the 1990’s. Value and small cap have done great the last decade vs.growth so the fund’s style has drifted. Not only that, but FLPSX is only 65% in the US and 35% overseas (Fund Holdings) as it has gone overseas to find value. Its top holding as of 9/30/07 was Petrobras, the oil company in Brazil!

If you really want to stick to plan, you should update your asset allocation to account for style drift each year and make sure you break-down your large holdings into their component asset classes, especially if this materially changes your overall asset allocation.

Make sure you visit:

Thursday, December 06, 2007

Grilled Bear Meat on the Menu

Groundzero posted the following comment in our facebook group "Spiral Forum: Trading Futures with Groundzero Discussions" to Glen's comment "The bears are feeling the heat right about now...."

Yes, and these bears have no idea what is still in store for them over the next few weeks...

GZ (December 6, 2007)
I replied here with the following observation:

If we come out of the hole like we did in 1998 after we had the big banking bottom in 1998, they will be in deep trouble. I recall my "(newsletter) explore portfolio" (started Sept. 30, 1998) went from being down about 20% in October (1998) to finishing December (1998) at up 58% followed by 117% more in 1999 (performance graph.) I think some of the four letter stocks I like (today) could be on some naked short lists, a new trick by bears to drive prices down.... so if they get insolvent, their broker/dealer backers will have to cover... it could be a bloody mess as some of us stock up grilled bear meat to feast on for the next ten years.
Being "naked short" means someone sold shares they were unable to borrow. Thus, if they are forced to cover short due to a margin call, they will have to go find shares to buy at any price. If you think a short covering rally is big, wait until we see some naked shorts forced to cover.

Recent 10 to 20% one day gains in stocks I have such as VLNC, VRGY and FNSR will look tame to what a naked short rally could look like.

Just think about how much these little stocks could move up if the investing public were to one day return to high risk growth stocks that go up.


Monday, December 03, 2007

Sy Harding MACD Buy Signal

Members of our "Investing for the Long Term" discussion forum report Sy Harding's model has a MACD buy signal for the US Stock Markets.

Sy Harding MACD Buy Signal


The MACD for the S&P500 has turned positive and members of our "Sy Harding Discussion Forum" at the facebook group "Investing for the Long Term" have said it was the "Seasons in the Sun Signal" to return to the US stock markets after getting out in May. There has been no confirmation if Sy Harding has actually issued a buy signal as rumors of a "second model" have appeared.

Request Invitation to FREE facebook discussion group "Investing for the Long Term."

Make sure you visit:

Sunday, December 02, 2007

Market Timer Sy Harding Favors Subprime Loan Bank Bailout

In an article this Sunday, Sy Harding said he favors a bailout of the banking system to prevent the economy from falling into even deeper trouble.

Sy makes a good point that a government bailout now will benefit everyone, not just the banks and risk takers:

"It's not even just the banks and the hapless homeowners who will lose their homes. It will be everyone. Think deep recession because a banking system on which business depends is barely operating. Everyone would suffer."

Sy reminds us that this would not be the first time taxpayers have come to the rescue of risk takers who lost.

"In the early 1990s, greed and foolishness got the banks in trouble again, resulting in the scandals and losses surrounding the infamous savings & loan collapse. Congress formed the Resolution Trust Corporation (RTC), which protected bank depositors by taking over or closing more than a thousand S&Ls and failed commercial banks, at a cost to taxpayers estimated to be more than $600 billion.

The current situation is just as serious
."

As a fiscal conservative who is a registered Libertarian, I hate to see the government bailout people who make bad choices at the expense of those who make responsible choices. But Sy Harding makes some very valid points that a collapse of our financial institutions won't do anyone any good. I believe those permabears who are short the stocks and negative on the US will speak loudly against this bailout, but we need to remember they are "talking their positions" with little interest in what is best for everyone.

Sy Harding MACD Buy Signal

On a seperate note, the MACD for the S&P500 has turned positive and members of our "Sy Harding Discussion Forum" at the facebook group "Investing for the Long Term" have said it was the "Seasons in the Sun Signal" to return to the US stock markets after getting out in May.

Saturday, December 01, 2007

Number of New Lows on NYSE above 450


Click to see full sized chart courtesy of stockcharts.com


This chart shows the number of NYSE stocks that are making new 52 week lows (red spikes) plotted with the S&P500 in black. You can see from the chart that spikes above 450 new lows are fairly rare. The chart also shows that buying after these spikes retreat has provided great returns in the short term (2001) and often in the long term (1994, 1998, 2002, 2004 and hopefully now in 2007.)


I believe this chart is more evidence that the market is trying, as odd as it seems near all time highs for the averages, to make a very major bottom similar to the 1998 and 2002/2003 bottoms.

Most really good bottoms before major advances are double or triple bottoms. 1998 was a double bottom and 2002/3 was a triple bottom with two significant lows made in 2002 and a test of those lows, about 4% higher, in 2003.

Also of note is this attempt to make a major bottom is coming on what I call a test of the breakout above the 2000 highs.

The bears will say the market is making a double top before crashing as the market comes apart.

Saturday, November 17, 2007

Stock Market Update

Click to see full sized chart courtesy of stockcharts.com

S&P500 $1,458.74 on 11/16/07
10 yr treasury 4.17%
Dividend yield (last 12 months: July '07) 1.85%
Dividend yield (indicated rate) 1.93%

Kirk's calculations from the data as of 11/17/07:
2007 Operating EPS (bottom up) = $90.15
YoY Growth $ $2.43
YoY Growth % 2.8%
PE Ratio = 16.2
Earnings Yield 6.2%

2008 Operating EPS (bottom up) = $104.99
YoY Growth $ $14.84
YoY Growth % 16.5%
PE Ratio = 13.9
Earnings Yield 7.2%

2007 As reported EPS (Top Down) = $78.70
YoY Growth $ -$2.81
YoY Growth % -3.4%
PE Ratio = 18.5
Earnings Yield = 5.4%

2008 As reported EPS (Top Down) = $91.31
YoY Growth $ $9.80
YoY Growth % 28.4%
PE Ratio = 16.0
Earnings Yield 6.3%

S&P Notes:
  • The GM charge reduced the As Reported and Core EPS by $4.37
  • With the exception of GM, to date, the vast majority of charges have been included in both Operating and As Reported earnings.
  • Goodwill impairment charges have been excluded from Core earnings.

Tuesday, November 13, 2007

Number of New Lows on NYSE above 450

This chart shows the number of NYSE stocks that are making new 52 week lows (red spikes) plotted with the S&P500 in black. You can see from the chart that spikes above 450 new lows are fairly rare. Last Friday (Nov. 9, 2007) the NYSE made a second spike above 450 in just a few months!
Click to see full sized chart courtesy of stockcharts.com

I believe this chart is more evidence that the market is trying, as odd as it seems near all time highs for the averages, to make a very major bottom similar to the 1998 and 2002/2003 bottoms.

Most really good bottoms before major advances are double or triple bottoms. 1998 was a double bottom and 2002/3 was a triple bottom with two significant lows made in 2002 and a test of those lows, about 4% higher, in 2003.

Also of note is this attempt to make a major bottom is coming on what I call a test of the breakout above the 2000 highs.

The bears will say the market is making a double top before crashing as the market comes apart.

Thursday, November 08, 2007

Bet on Citigroup Hurts Edward (Eddie) Lampert

Often compared to legendary Warren Buffett, Jim Cramer's college buddy Eddie Lampert made a big bet on Citigroup that has not looked good in the short-term. A New York Times article today reports:
In August, a hedge fund controlled by Edward S. Lampert, the value-oriented investor, disclosed that it had built a $1.3 billion stake in Citigroup, the beleaguered financial giant.

In the last year, RBS Partners, an affiliate of Mr. Lampert’s ESL Investments, has steadily poured money into Citigroup shares. As of March 31, it valued its stake, then about 15.24 million shares, at $782.6 million. It increased that stake to 24.8 million shares by June 30, giving its Citigroup holdings a value of about $1.3 billion, regulatory filings show.

Citigroup shares closed at $33.41 yesterday. That would value RBS’s stake at $828.6 million, a paper loss of about $471 million from late June.
Not only did Eddie Lampert, like Citigroup when it was much higher, his buddy Jim Cramer thought Citigroup was a great stock to buy at $53, collect the dividend and wait for it to go higher with a new CEO or announcement of a break-up. In the July 17th, 2007 article, "Cramer's Take on Eddie Lampert's Stocks," Jim is quoted as saying of Citigroup:

"For the life of me I don't understand why everyone isn't buying Citigroup. You've got a much better than average yield," Cramer said in a June 21 RealMoney blog post. "You have a management that doesn't have a clue and could be gone in an instant, which would mean you could pick up a quick $3 or $4. You have a company that could be a big gainer worldwide, and it is a ROWer (that's rest-of-world, for those who've missed my thousand references to it)."

and

"I am blown away that this stock has been stuck at $53 with all of these positives lurking. This isn't Bank of America (BAC) , where you can only hope that they stop buying things. This is one of those stocks where you could have a dramatic move up on any talk of a breakup or a change at the helm, and in the meantime you will get paid to wait."

With Citigroup, I've made a lot of money in my newsletter explore portfolio buying back in Sept 30, 1998 AFTER it crashed from the mid $30's to the teens. I sold enough shares to be on "house money" but I would have done better to have sold in 2000 when it hit the mid $50's before falling 50% to make a bear market low in 2002. That is not my style.

I like to buy great companies when they go on sale, the same way I buy pants and shirts at Macys (M) after holiday markdowns. After holding all through spring and summer, I am wearing a $58 Merino wool polo sweater-shirt now that I bought last year for $15 the day after Christmas. Even if Citigroup goes lower, you should be able to wrap up some shares now, collect the dividend and brag about how smart you are in a year or two when we get past this subprime mess and the stock has recovered.

Since 2002, Citigroup rallied again from the mid $20's to a new all time high in the mid $50's before the sub prime meltdown crushed the stock into the mid $30's. Yesterday, Citigroup clsoed at $33.41, at another major support line shown on the graph below.

Click to view larger graph

I've held all along and collect the dividend. I hope and believe this is yet another great buying opportunity, but I'll get no "trader points" for being a long term buy and holder on Citi, which is what I often do once I am on "house money" for stocks.

Note: I also own Citigroup in my personal portfolio. I may add shares here but I have yet to decide. Yesterday I added to my SPY position using profits taken in my international mutual funds. SPY is the ETF for the S&P500 which has a significant weighting in the financial sector.


11/08/07 8:15AM PST Update: Here is a chart I found at "SeekingAlpha: Citigroup 'Crisis': Some Perspective Is In Order" showing the same support line with the "crisis of the day" listed.


Click to view larger graph

Are you one to say "this time it is different?" I hope not.

Friday, November 02, 2007

I-Bond and Series EE Bond Rates for November 2007

Newly issued Series I Savings Bonds (aka iBonds and I-Bonds for "Inflation Protected Bonds") will pay 4.28% and Series EE Bonds will pay 3.00%. I-Bonds are a 100% safe way to defer taxes while getting inflation adjusted return for up to 30 years. These rates for new bonds are effective from November 2007 through April 2008.

More Information and links at "I Bonds Explained"

Earnings rates for I bonds and fixed rates for EE bonds are set each November 1 and May 1. Interest accrues monthly and compounds semiannually. Bonds held less than five years are subject to a three-month interest penalty. Both series have an interest-bearing life of 30 years; the EE bond fixed rate applies to a bond's 20-year original maturity.

I Bond Earnings Rate 4.28%, Fixed Rate 1.20%

The earnings rate for I-Bonds is a combination of a fixed rate, which applies for the life of the bond, and the semiannual inflation rate. The 4.28% earnings rate for I bonds bought from November 2007 through April 2008 will apply for their first six months after issue. The earnings rate combines a 1.20% fixed rate of return with the 3.06% annualized rate of inflation as measured by the Consumer Price Index for all Urban Consumers (CPI-U). The fixed rate applies for the 30-year life of I bonds purchased during this six-month period. The CPI-U increased from 205.352 to 208.490 from March through September 2007, a six-month increase of 1.53%.

Here is what older iBonds will pay, based on their base rate with the latest inflation adjustment

Base New 6-Month
Rate Rate

1.0%----4.08%
1.1%----4.18%
1.2%----4.28%
1.3%----4.38%
1.4%----4.48%
1.6%----4.68%
2.0%----5.09%
3.0%----6.11%
3.3%----6.41%
3.4%----6.51%
3.6%----6.72%


Ask questions at our iBond Discussion Forum at Facebook's "Investing for the long term" group.

October Job Growth Strongest Since May 2007

The US economy created 166,000 net new jobs in October 2007.

The US Labor Department reported today the best job growth since May 2007. Despite the weaknesses in the housing and credit markets, the US economy created 166,000 net new jobs in October 2007. Of those new jobs, 130,000 were created by the private sector. Growth was strongest in health care and temporary help while manufacturing and construction continued to lose jobs.

August and September job growth was revised down by 10,000. Only 96,000 new jobs were created in September.

The unemployment rate for October held steady at 4.7% as the economy created just enough jobs to absorb new workers.

Average hourly earnings rose 0.2% or 3¢ to $17.58 while the average workweek held steady at 33.8 hours.

Offsetting the good news, a separate “Household Survey” of 60,000 households showed a loss of 250,000 workers, the third decline in the last four months.

Sunday, October 28, 2007

ISP Bandwidth Problems Good News for Fiber Makers

Fiber optics companies like Finisar (FNSR), JDS Uniphase Corp. (JDSU), Opnext, Inc. (OPXT) and privately held Avago Technologies Limited all stand to benefit from the bandwidth woes that ail internet service providers and broadband cable companies such as Comcast (CMCSA), Verizon Wireless (VZ) and AT&T Inc. (T).

Comcast users report that the file transfer is cut off when they try to download legal copies of movies when they use peer-to-peer, file-swapping software like BitTorrent and Gnutella. Comcast has acknowledged "delaying" some subscriber data transfer, but said "the delays are temporary" and intended to improve surfing for other users. Vindu Goel of the San Jose Mercury News wrote:


You're at home and get a hankering to watch a movie. You fire up your computer, turn on your Comcast high-speed cable modem and start downloading a legal copy of the vintage Hitchcock thriller "The Man Who Knew Too Much" using BitTorrent, a popular file-sharing program.

Suddenly, the transfer stops. The computer sending you the file has dropped the connection. You wait a minute. Nothing happens. You try restarting the transfer. The data flows for a few seconds, then stops again.

What's going on? Comcast is breaking your connection. On purpose.

This does not sound "temporary" to me.

Is this legal? Goel reports:

Comcast's user agreement officially bans file-sharing and "gives them the ability to do anything they darn well please," said California Deputy Attorney General Robert Morgester, who prosecutes Internet crimes in the state.
Why does Comcast stop users from using the bandwidth they think they paid for? A quick search for "Video on Demand" shows Comcast offers Video on demand for a fee. "Net Neutrality" advocates, who want the FCC to prevent internet service providers from favoring some content over others, have argued that "virtual monopolies" will force internet users to pay for things they could get for free if they had unrestricted access to bandwidth.

The heat is already on the companies. The AP report "Senators Want Probe on Content Blocking" says On Friday October 26, "Senators. Byron Dorgan, D-N.D., and Olympia Snowe, R-Maine, said the incidents involving several companies, including Comcast Corp., Verizon Wireless and AT&T Inc., have raised serious concerns over the companies' "power to discriminate against content."

Who stands to benefit?

In the long run, if you pay a company for bandwidth then elect to get your video content from one of its competitors, then US laws should prevent a monopoly or powerful company from stopping you from doing this. Microsoft paid a heavy price for using its monopoly power to prevent computer companies from putting "unapproved" software and features on the Windows desktop.

I am sure ISPs will eventually have to give unrestricted access to bandwidth so you can download your movies from Blockbuster, Netflix or any of their competitors that offer you a better price. If this downloading makes the overall experience poor for their paying customers who share the network, then they will have to upgrade the cable networks with fiber optics.

Some of the leading fiber optics companies are Finisar Corp, JDS Uniphase Corp. (JDSU), Opnext, Inc. (OPXT), Bookham Inc. (BKHM) and privately held Avago Technologies Limited (where I worked on fiber optics when it was part of HP in the 1980's and 1990's.)

Another company I own that may benefit is Carrier Access (CACS). Carrier provides "Exxtenz" product that enables service providers to utilize passive optical networking, PON, technology to deliver services, such as wire-speed Ethernet, voice, T1, and video services to businesses.

Disclaimer: The author is long Finisar (FNSR) and Carrier Access (CACS) at the time of this article.

BKHM: Oct 26 $3.15 -5.12%
FNSR: Oct 26 $2.24 -5.08%
CACS: Oct 26 $3.43 -3.65%
JDSU: Oct 26 $14.73 +0.89%
OPXT: Oct 26 $13.29 -0.75%


October 2007 State Street Investor Confidence Falls to 82.6

The State Street Investor Confidence Index Fell From 88.7 to 82.6 in October 2007. This the lowest reading since November 2006 when the reading was 82.2 and the DJIA only $12,280. The confidence index peaked at 99.6 in August 2007 with the Dow Jones Industrial Average at $13,379.

Click Sentiment Chart to see full sized

Press Release :

Boston, October 23, 2007: State Street Global Markets, the investment research and trading arm of State Street Corporation (NYSE:STT), today released the results of the State Street Investor Confidence Index® for October 2007. Global Investor Confidence fell by 6.1 points to a level of 82.6, from last month’s revised reading of 88.7. Sentiment in North America declined from 102.8 to 89.2. Asian investors were also feeling more cautious, resulting in a decline of 1.7 points in the Asian Confidence Index. Only in Europe did institutional risk appetite improve, rising from 82.9 to 83.6.
According to State Street, their “State Street Investor Confidence Index® measures the attitude of investors to risk. Developed by Harvard Professor Ken Froot and State Street Associates Director Paul O'Connell, the Index uses the principles of modern financial theory to model the underlying behavior of global investors. Unlike other survey-based confidence measures that focus on expectations for future prices and returns, the Index provides a quantitative measure of the actual and changing levels of risk contained in investment portfolios representing about 15% of the world's tradable assets.

More Graphs

I cover five other sentiment indicators in my newsletter. These indicators are:

  • ISE (International Securities Exchange) Sentiment Index
  • II-BBS: Investors’ Intelligence Bull Bear survey
  • CBOE (Chicago Board Options Exchange) Put/Call Ratio (CPC)
  • VIX (CBOE Volatility Index)
  • AAII Bull/Bear Ratio (American Association of Individual Investors)

Friday, October 26, 2007

John Bogle on Managed and Index Funds

Runner Twentysix posted this in our "Asset Allocation" forum in the facebook group "Investing for the Long Term."

Index funds or managed funds when allocating your asset classes?

Here is some eye opening info from Jack Bogle from his “The Little Book of Common Sense Investing”, Chapter 8.

Jack took a look at the 355 equity funds in existence in 1970 to examine their 36 year track record.

He says the first surprise is that 223 of the funds,


  • 2/3 of the total no longer exist, have gone out of business, mostly from poor performance.

  • Another 60 underperformed the S&P 500 significantly by more than 1% per year.

  • 48 were within 1%, above or below.

  • 15 funds outpaced the market by > 1%

  • 9 funds outpaced the market > 2%

  • “…a superiority that may be due as much to luck as to skill.”

    “When the accomplishments of these nine successful mutual funds were noticed by investors, cash poured in, and they got large….As they grew, the records of six of them turned lackluster. One fund reached its performance peak way back in 1982, 24 long year ago. On balance, it has lagged ever since. Two other peaked in 1983. The remaining three peaked no more recently than 1993.” (one was Lynch’s Magellan Fund).

  • That leaves only three superior funds.
“The core of you program should consist of at least 50 percent index funds, up to 100 percent”…. “Actively managed mutual funds? Yes. But only if they are run by managers who own their own firms, who follow distinctive philosophies, and who invest for the long term, without benchmark hugging. (Don’t be disappointed if the managed fund loses to the index fund in at least one year of every three!)"


This is great advice from John (Jack) Bogle. I recommend investors place 80 to 95% of their investment assets into "core" portfolios that use very low index funds from Vanguard or Fidelity (or anywhere else you can get the index funds I recommend in my newsletter that you can find with lower annual expense charges.)

With the remaining 5 to 20% I "explore" with individual stocks where I try to beat the averages over the long term (my results) while avoiding "benchmark hugging." This means I don't expect my good and bad years to always match that of the major indexes. Higher return comes at a price of higher volatility but you can use the time of lower returns to take profits in what is up to add to what is down.
I heard John Bogle on a TV interview say he uses managed funds the same way I use and recommend my "explore portfolio."
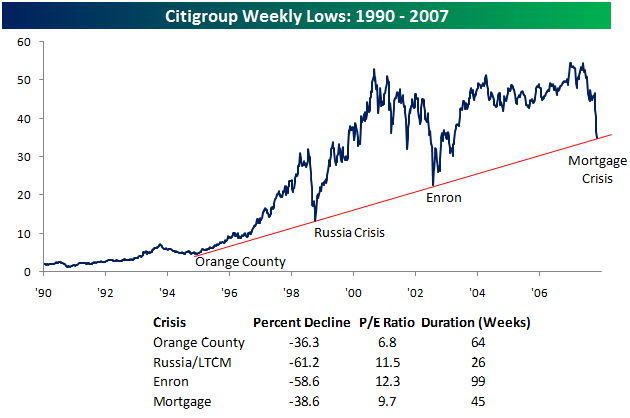

Monday, October 22, 2007

Citigroup Compelling 20 years after Black Monday

Twenty years after Black Monday (see "Black Monday 1987 Graphs") Citigroup (Ticker C, Charts) looks even more compelling to me today than when I added it to my newsletter “Explore Portfolio” back in September 1998 at a fraction of today’s price.
.
Click chart to View full size - More charts

On October 1, citing “dislocations in the mortgage-backed securities and credit markets, and deterioration in the consumer credit environment” Citi said its third quarter 2007 net income would decline about 60% from the year ago $5.06 Billion. Citi said it would:
  1. write down about $1.4B of its $57B portfolio of highly leveraged loans
  2. lose about $1.3B on the value of securities backed by subprime loans
  3. lose $600M in fixed-income credit trading. It also said consumer credit costs rose $2.6B, mostly due to a boost in loan-loss reserves.
CEO Chuck Prince said during the earnings conference call
  • "Looking ahead to the fourth quarter, while we obviously cannot predict market movements or other unforeseeable events that may affect our businesses, we expect to return to a more normal earnings environment as the year progresses."
Citigroup's plan is to write off all the bad news in this quarter and hope they can look forward to the future. If they over estimated their "subprime meltdown losses" then they can reduce loss reserves in future quarters to report better than forecast results going forward.

The fear is they under estimate their losses and more write-downs will follow. I believe people are selling like lemmings running off a cliff on fear things are much worse. Those of us with the ability to buy through periods of massive fear often end up with superior returns.

Technically, the chart for Citigroup found support on the dashed-blue uptrend line that marked the bottom for two major fear days in 1998 and 2002. The fear from this subprime meltdown is no different.

With a dividend of $2.16 and today's closing price of $42.61, Citi pays you a 5.07% yield that is considerably better than the 4.41% 10-year Treasuries currently pay.

Sunday, October 21, 2007

Black Monday 1987 Graphs

Charts of the markets for Black Monday October 19, 1987.

Two year graphs from one year before through one year after Black Monday.

S&P500 Click to see in more detail

S&P500 & DJIA
Click to see in more detail

DJIA - Dow Jones Industrial Average
Click to see in more detail

Saturday, October 20, 2007

Warren Buffett Sold Last Shares of PetroChina Before Price Surges

Despite his reputation for "buy and hold forever," billionaire Warren Buffett said last week that his company, Berkshire Hathaway, had sold all shares of PetroChina Co. Ltd (Ticker=PTR, website), a Chinese oil conglomerate.
  • "Our Favorite holding period is forever.” -Warren Buffett
Activists had urged Buffett to sell his PetroChina shares due to the world's second largest companies ties to strife-torn Sudan via Petrochina's parent company, China National Petroleum Corp.

Click to see full size graph

Despite vocal activist shareholders in support of this divestiture, Buffett insisted in an interview on the new Fox Business Network (FBN) the decision to sell was driven by valuation.

  • "If it went down a lot I'd buy it back."

Buffett told Rupert Murdoch's FBN that the recent price gains of PetroChina's shares means he sold too soon and "left a lot of money on the table."

Buffett said Berkshire Hathaway made as much as $3.5 Billion dollars on the initial $500 million investment. As of July 2007, Berkshire Hathaway owned 11 percent of the publicly traded shares.

Berkshire bought PTR in 2003. Friday PTR closed at $232.98 after peaking at $266.81.


Friday, October 19, 2007

Elaine Garzarelli is Bullish: Indicators on a Strong Buy Signal

Today Elaine Garzarelli is very Bullish with her Indicators on a 75% Strong Buy Signal.

Elaine Garzarelli is one of the few analysts that called the 1987 bear market and got out before the crash 20 years ago today. (See 20 Years After Black Monday: October 19, 1987)

During a CNBC interview today, Elaine Garzarelli had this to say:
  • Market in '87 was 35% over valued
  • Today it is 28% under valued

Her indicators today are at 75% for a major buy signal

  • 1987 they were at 9%
  • Below 30% is a sell signal
  • Above 65% is a MAJOR buy signal

Elaine has 14 indicators in 4 areas with 25% weighting for each area. The areas are:


  • Economic Cycle: Earnings will bottom this quarter and next. Near the bottom not the top. Bullish
  • Monetary Policy: Fed is easing. Before the crash the Fed was raising rates; Bullish
  • Valuation: Market via the Fed Model is 28% under valued using her "Street low" earnings estimates. This is Bullish
  • Sentiment: Neutral hence the 75% reading.

She thinks oil is near a peak now and will come down since everything outside the US is slowing down too. But she she said the economy could handle oil going to $125 per barrell and still grow as long as it gets there slowly.


Click Graph to see it full sized

Wednesday, October 17, 2007

Bradley Turn Dates for 2008

More info at

From Bradley Turn Dates for 2007, today, 10/17/07, is supposed to be the most important turn date for 2007.

The Bradley siderograph (more information) was developed in the 1940's by Donald Bradley to forecast the stock markets. Bradley assigned numerical values to certain planetary constellations for every day, and the sum is the siderograph. It was originally intended to predict the stock markets. William Eng, a noted technical analyst, singled out the Bradley as the only 'excellent' Timing Indicator in his book, "Technical Analysis of Stocks, Options, and Futures" (source: Astrikos).

These are the eight Bradley Turn Dates for the remainder of 2007 and 2008:

  1. December 22, 2007 (A most important date)
  2. March 8 to March 9, 2008
  3. April 4, 2008
  4. April 27, 2008
  5. May 24, 2008
  6. June 6, 2008 (A most important date)
  7. September 9, 2008
  8. September 20, 2008
  9. December 14, 2008 (A most important date)

Also see: Bradley Turn Dates for 2007.

Two investment newsletters rely heavily on the Bradley Siderograph and their returns are terrible. Mark Hulberts "Hulbert Financial Digest" reports in the "Long Term Performance Ratings through June 30, 2006" the following:
  • "The Crawford Perspective" has an average annual return of only 4.9% since its 12/31/88 inception. If shorting is allowed, the returns are a negative 7.2% while a buy and hold of the Wilshire5000 over the same period yielded an average annual return of +11.5%!
  • Peter Eliades' Stockmarket Cycles has an average annual return of only 4.7% since its 12/31/84 inception while a buy and hold of the Wilshire5000 over the same period yielded an average annual return of +12.4%!

My newsletter has a much better record but I am always interested in new ideas. Click for a FREE SAMPLE issue.

Monday, October 15, 2007

Piper Jaffray Target for Finisar

Finisar Corporation (more FNSR Charts) designs, manufactures and markets fiber-optic subsystems and network performance test and monitoring systems that enable high-speed data communications over local area networks (LANs), storage area networks (SANs) and metropolitan access networks (MANs).

Today Piper Jaffray started covering Finisar (FNSR) with an outperform rating and a $4 price target.

"We believe the stock was oversold following its July quarter earnings call and has created a compelling entry point."
Finisar is focused on the application of digital fiber optics to provide a broad line of high-performance, reliable, value-added optical subsystems for data networking and storage equipment manufacturers. Its line of optical subsystems supports a wide range of network applications, transmission speeds, distances, physical mediums and configurations.

Click chart to view it full sized

To get my current thoughs about Finisar in greater detail and more, subscribe NOW and get the October issue of “Kirk Lindstrom's Investment Newsletter") for FREE!

Disclaimer: I am long Finisar in both my newsletter and personal portfolios. I accumulated Finisar between $1.01 and $1.99 in my newsletter portfolio so I have significant gains at this time. I may sell or add to my position at any time. I will tell my newsletter subscribers when I sell, but I will not necessarily post about it online before or after.

Sunday, October 14, 2007

20 Years After Black Monday: October 19, 1987

As I write this, the stock market is near an all time record high just like it was on Black Monday in 1987. On October 19, 1987 (Black Monday) the US stock market fell 22% in a single day. Can do the market do the same now, twenty years later?

Circuit breakers and trading curbs should prevent another 22% single day fall that came from sellers wanting out at any price while buyers were nowhere to be found, but nothing is impossible.

Back in 1987, the Standard & Poor's 500 traded at over 22 times earnings while Treasury bond yields hit 10%. Today the S&P500 trades at about 18 times earnings and long-term treasury bonds yield less than 5%. The "Fed Model" (that I update each month in "Kirk Lindstrom's Investment Newsletter") says the earnings yield in a fairly valued market should be equal to the ten-year US Treasury Bond rate.

In 1987:
  • PE was 22
  • Earnings Yield = 1/PE
  • 1/PE = 1/22 = 0.0455
  • 0.0455 x 100% = 4.55%
  • 10-year Treasury = 10%
  • Over Valuation = 10% / 4.55% = 2.2

Today:

  • PE is 18
  • Earnings Yield = 1/PE
  • 1/PE = 1/18 = 0.0556
  • 0.0556 x 100% = 5.56%
  • 10-year Treasury = 4.68%
  • Over Valuation = 4.68% / 5.56% = 0.84

According to the very simple application of the Fed Model, the market was overvalued by a factor of 2.2 in 1987 and is under valued today by 16%.

To get more detailed monthly updates on the Fed Model and more, subscribe NOW and get the October issue of “Kirk Lindstrom's Investment Newsletter") for FREE!

Friday, October 05, 2007

US Economy Gains 110,000 Jobs in September 2007

U.S. job growth rebounds. 110,000 new jobs were created by the US economy in September

(5:30AM PST) August was revised from a loss of 4,000 jobs a gain of 89,000 new jobs, mostly in government.

This better than expected jobs report could tip the scales away from "recession fears" back to "fear of inflation" as the markets obsess over needing something to worry about

U.S. Sept. job growth seen in health care, food services
U.S. Sept. household employment rises 463,000, most in 2 yrs
U.S. payrolls annual benchmark revision down 297,000
U.S. Sept. public teacher hiring rises 46,000
U.S. Sept. average hourly earnings up 0.4%
U.S. Sept. private-sector payrolls rise 73,000
U.S. Sept. unemployment rate 4.7% as expected
=> 4.7% Unemployment rate was the highest in a year.
U.S. July, Aug. payrolls revised up 118,000
U.S. Sept. nonfarm payrolls up 110,000 vs. 113,000 expected

DJIA


Click Graph to View Full Sized

Treasuries plunged after jobs report; 10-yr yield up to 4.597%
S&P 500 futures rise 10.40 points to 1,563.00
Dow industrial futures up 69 points at 14,110
Dollar rallies after jobs report; euro down 0.5% at $1.4061
Crude futures drop 39 cents at $81.05

Unemployment Rate Chart from BLS

(Series Id: LNS14000000 Seasonal Adjusted)

© Kirk Lindstrom


Thursday, September 27, 2007

AAII Survey Bulls-Bears vs. DJIA Graph for 09/27/07

This chart shows the 52-week moving average of the AAII bull/bear index (American Association of Individual Investors). 52 weeks removes seasonality from the number and gives startling results.

Click chart to see full sized pdf image

I explain what this sentiment indicator and others mean to me in my newsletter. I post them here to share for all to read and make comments. Request Invitation to facebook discussion group where we have a "Sentiment" topic to discuss the weekly data.

Subscribe now and get the September issue of “Kirk’s Investment Newsletter” for FREE!

Disclaimer: Past performance does not guarantee future results but I prefer to listen to people who have demonstrated good, long-term published performance.

Tuesday, September 25, 2007

Value in Growth at Lam Research and Verigy Inc.

Someone with a large position in Warren Buffett’s Berkshire Hathaway (ticker BRKA) asked if he should buy another cash loaded company with similar valuation metrics, Wesco Financial Corp. (WSC). My reply was the real value today is in some small capitalization technology stocks like Lam Research (LRCX) and Verigy (VRGY.) Here is my reasoning.

One of the reasons I have stayed away from Berkshire Hathaway is its “Warren E. Buffett Premium.” This is what people pay to own BRKA over “fair value” so Warren Buffett can manage their money. What happens to the price of BRKA if Buffett dies?

BRKA today reminds me of General Electric (GE) in 2000 when it still had its "Jack Welch Premium" not to mention the daily gushing on CNBC about how much money the reporters were making in the individual stock they could own. In 2000 GE had a PEG (Price-to-earnings ratio divide by its 5-year growth rate) twice that of the S&P500. Today that premium is gone and GE at $41 is still down about 30% from its 2000 peak while the S&P500 is back to its 2000 peak. High premiums are risky.

Selling at $117,200 with $30,343 per share in cash, BRKA is 26% cash. This survey of CD rates says you can get 5.0 to 5.75% at many banks in CDs. If I want to pay a premium for Warren Buffett to manage my money, then I would want his return on assets to beat safe CDs and treasuries enough to overcome this premium at a minimum.

Yahoo! finance lists BRKA’s “management effectiveness” as:

    Return on Assets (ttm): 4.65%
    Return on Equity (ttm): 11.34%
    (ttm is trailing twelve months)


With Valuation metrics:

    Trailing P/E (ttm, intraday) = 14.99
    Forward P/E (fye 31-Dec-08) = 19.35
    PEG Ratio (5 yr expected) = N/A (no earnings growth predicted)
    (fye is for year ending)


Why not put 25% of your money in 5.75% CDs and invest the other 75% in stocks with better GARP (Growth At Reasonable Price) metrics?

Compare the above numbers for BRKA to one of my larger holdings and a company I have already made about sixteen (16!) times my money on since buying it for my newsletter and personal portfolio in 1998, Lam Research (Ticker LRCX.)

Yahoo! finance lists Lam’s “management effectiveness” as:

    Return on Assets (ttm) = 21.21%
    Return on Equity (ttm): 43.29%

With valuation metrics:

    Trailing P/E (ttm, intraday)= 12.24
    Forward P/E (fye 25-Jun-08) = 12.21
    PEG Ratio (5 yr expected) = 0.65

Verigy is another “GARP” stock I have been buying for my newsletter portfolio and myself. Yahoo! finance lists Verigy’s “management effectiveness” as:

    Return on Assets (ttm): 10.38%
    Return on Equity (ttm): 18.48%

With valuation metrics:

    Trailing P/E (ttm, intraday)= 19.96
    Forward P/E (fye 31-Oct-08) = 13.47
    PEG Ratio (5 yr expected) = 0.79

Verigy has a similar cash/share ratio as BRKA but it makes far better returns overall.

I think there is great value now is in technology stocks that are not in the headlines. Everyone knows about Google (GOOG) and Apple (AAPL) but how many have heard of Lam Research or Verigy? The way to make big gains is to buy well managed growth stocks before everyone has heard of them. I have made good money already in both Lam and Verigy but I think there is much more to be made.

In addition, how are people trying to help third world countries improve? Are they giving them cans of Coke (KO) Geico insurance, Sees candy and Gillette razors (PG,) all subsidies of BRKA, or are they giving the kids portable, cheap, laptops with wireless connectivity that operate on the sun or hand cranking? Lam and Verigy are two of my best-valued stocks that make picks and shovels that help make this new technology possible.

BRKA is mostly a perceived "value stock" and we have had about 7 years where investors have shunned growth to buy good, safe value stocks. The numbers I posted above for Lam and Verigy, stocks I buy and sell for added return around a core position, show why I think a rotation to growth with value should occur soon, if it has not already started.

Subscribe now and get my just released October 2007 Newsletter with my two core portfolios plus my more volatile (and higher long term return) explore portfolio with the latest buy and sell targets.

Monday, September 24, 2007

Investors' Intelligence Bulls-Bears vs. DJIA Graph for 09/22/07

This chart shows the 52-week moving average of the “Investors Intelligence Survey“ bulls minus bears data. 52 weeks removes seasonality from the number and gives startling results.

Click to view larger pdf graph

I explain what this sentiment indicator and others mean to me in my newsletter. I post them here to share for all to read and make comments. Request Invitation to facebook discussion group where we have a "Sentiment" topic to discuss the weekly data.

Tuesday, September 18, 2007

Chart of Stock Markets vs Fed Funds Rate

Click chart to see it full sized

The Federal Reserve cut its Fed Funds interst rate today from 5.25% to 4.75% and they cut their discount rate to from 5.75% to 5.25%. Below is the text of their statement explaining their actions.

Release Date: September 18, 2007

  • For immediate release
    .
    The Federal Open Market Committee decided today to lower its target for the federal funds rate 50 basis points to 4-3/4 percent.
    .
    Economic growth was moderate during the first half of the year, but the tightening of credit conditions has the potential to intensify the housing correction and to restrain economic growth more generally. Today’s action is intended to help forestall some of the adverse effects on the broader economy that might otherwise arise from the disruptions in financial markets and to promote moderate growth over time.
    .
    Readings on core inflation have improved modestly this year. However, the Committee judges that some inflation risks remain, and it will continue to monitor inflation developments carefully.
    .
    Developments in financial markets since the Committee’s last regular meeting have increased the uncertainty surrounding the economic outlook. The Committee will continue to assess the effects of these and other developments on economic prospects and will act as needed to foster price stability and sustainable economic growth.
    .
    Voting for the FOMC monetary policy action were: Ben S. Bernanke, Chairman; Timothy F. Geithner, Vice Chairman; Charles L. Evans; Thomas M. Hoenig; Donald L. Kohn; Randall S. Kroszner; Frederic S. Mishkin; William Poole; Eric Rosengren; and Kevin M. Warsh.
    .
    In a related action, the Board of Governors unanimously approved a 50-basis-point decrease in the discount rate to 5-1/4 percent. In taking this action, the Board approved the requests submitted by the Boards of Directors of the Federal Reserve Banks of Boston, New York, Cleveland, St. Louis, Minneapolis, Kansas City, and San Francisco.
Kirk's Comments: I view this is positive as the Fed is taking action to help the credit markets and it has returned its bias to "neutral." What this all means to the stock markets is discussed in my October newsletter I am writing now and hope to release by the weekend. Subscribe now and get my list of stocks I think will benefit from today's action.


    Saturday, September 15, 2007

    Insider Buying at AGEN by Chairman and CEO Garo H. Armen

    On Feb 9, 2007 Garo H. Armen, CEO and Chairman of the Board, bought 50,000 shares to increase his direct holdings to 106,601 shares. I wrote about it and my buy on the news here. The stock soared shortly after this purchase and has recoverd to a seven month gain of 27% trading at $2.45. Details:

    • OFCR/ CEO & Chair o/ Board = Classification of Insider
    • $96k = Value of I-Buy trade(s)
    • 50k = Number of Shares
    • $1.93 = Average Price Paid
    • $1.91 = Recent Stock Price (delayed)
    • 132k = Average Daily Volume (composite timeframe)
    • $88M = Company Market Capitalization
    • 2007-02-09 = Purchase Date
    • 2007-02-13 = Filing Date
    • 13:21:59 = SEC Arrival TimeStamp

    More AGEN Charts

    Yesterday, September 14, 2007, Garo H. Armen bought another 50,000 shares of AGEN at an average price of $2.33. Details:

    • OFCR/ Chair & CEO = Classification of Insider
    • $117k = Value of I-Buy trade(s)
    • 50k = Number of Shares
    • 2.33 = Average Price Paid
    • 2.45 = Recent Stock Price (delayed)
    • 315k = Average Daily Volume (composite timeframe)
    • 112M = Company Market Capitalization
    • 2007-09-14 = Purchase Date
    • 2007-09-14 = Filing Date
    • 17:31:46 = SEC Arrival TimeStamp (Filing appears on SEC site 30-60 secs later)

    SEC Form 4 shows Armen how holds 266,610 shares of common stock directly and holds another 11,489,274 via By Antigenics Holdings LLC and Armen Partners LP ( 3 ).

    The last insider buy in Feb was a good time to buy as the stock soared from $1.93 to about $5.25 two months later. Even if you didn't sell at the top and held, a 27% gain in seven months is nice.

    Disclaimers:
    1. I first reported this purchase here on Feb 13, 2007.
    2. I own AGEN in my personal portfolio and bought 1,000 shares on the Feb 9, 2007 news.
    3. I may trade the ups and downs of AGEN in either or both my personal and my newsletter explore portfolios without announcing it here or anywhere else.
    4. Dr. Armen is CEO, Chairman of the Board of Managers and a member of Antigenics Holdings LLC ("Holdings") which, as of the date of this report, owns 11,154,274 shares of Antigenics Inc. common stock. Dr. Armen has a pecuniary interest in only a portion of the shares held by Holdings and disclaims beneficial ownership except to the extent of his pecuniary interest therein. Dr. Armen is also General Partner of Armen Partners LP. Armen Partners LP owns a total of 335,000 shares of Antigenics Inc. common stock. Dr. Armen has a pecuniary interest in only a portion of the shares held by Armen Partners LP and disclaims beneficial ownership except to the extent of his pecuniary interest therein.

    Followers - Click "follow" to get an email alert for new articles

    Kirk Lindstrom's Investment Letter Performance