The "Fear & Greed Index" from CNN Business is currently showing "moderate Fear" with a reading of 42 on a scale of zero to one hundred. Here is a snapshot of the index for today.
Fear & Greed Index for May 8, 2019
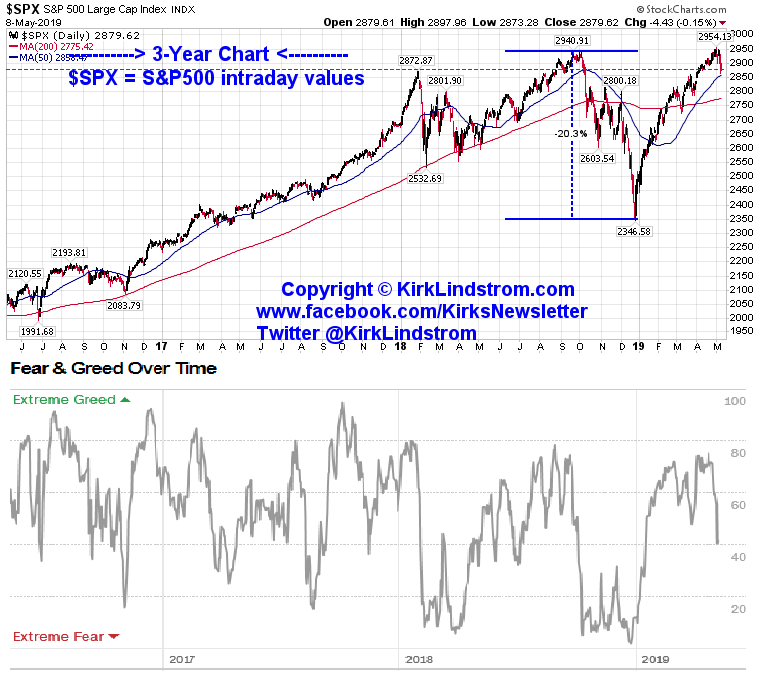
This chart shows the Fear and Greed index readings over the past 3 years plotted with the S&P 500 over the same period.
This index is a summation of seven indicators explained in detail here.
- Stock Price Momentum: The S&P 500 versus its 125-day moving average
- Stock Price Strength: The number of stocks hitting 52-week highs and lows on the New York Stock Exchange
- Stock Price Breadth: The volume of shares trading in stocks on the rise versus those declining.
- Put and Call Options: The put/call ratio, which compares the trading volume of bullish call options relative to the trading volume of bearish put options
- Junk Bond Demand: The spread between yields on investment grade bonds and junk bonds
- Market Volatility: The VIX, which measures volatility
- Safe Haven Demand: The difference in returns for stocks versus Treasuries
How I use this information:
You can see from the two graphs below that my portfolio is well above its 2018 peak while the S&P 500 with dividends reinvested in SPY is back where it started. This "ratcheting" of returns adds up over time, especially with compounding.
I use periods of strength with highly bullish sentiment (Max greed on the Fear and Greed charts) to take profits then I use the cash to buy again when others are fearful. You can see from my Explore Portfolio performance graph that this has allowed me to crush the returns of the S&P 500 while having far less risk with typically 60 to 65% in stocks. If you are young, you could probably do even better with more in my Explore Stocks as I did when I was much younger.
Don't miss out!

And get the May 2019 Issue for FREE!
To understand more about my method, please read these KEY articles:


 kirklindstrom.com
