
I added to many equity positions.
Below is a brief summary of my longer Seeking Alpha article titled:
I've explained in past articles such as "SPY 8% Off Record High While WLI Rises To 6-Week High" why I like SPY as an investment for the long-term. I use fundamentals to pick individual stocks and SPY for my portfolio, but I seldom buy as they are making new 52-week highs. I try to buy when they are on sale and when the blood is running in the streets.
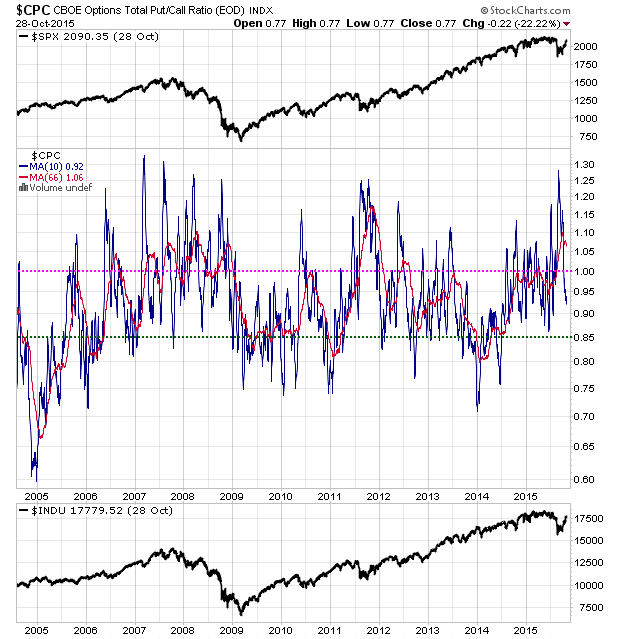
About a month ago, some of my sentiment indicators reached lows not seen in a year or longer.
To get better prices, I start with my list of "Explore Portfolio" stock picks then wait for market pullbacks and extreme negative sentiment levels to buy if they haven't quite reached the "low ball" prices I set ahead of time to buy during market panics and other periods of market inefficiency. Said another way, I like to take profits as markets make new highs then buy back shares when my sentiment charts loudly shout at once "Buy" as most investors are afraid and selling.
To see all six of my charts, go here.


 kirklindstrom.com

No comments:
Post a Comment