Don't Miss Out On Great Gains! - Best Investment Newsletter


Click for FREE sample of Kirk Lindstrom's Investment Letter

Don't miss out! Subscribe Now

google.com, pub-7001134751860982, DIRECT, f08c47fec0942fa0

Search For More

Thursday, November 21, 2013

Graph 10 & 30-Yr T-Bonds vs S&P500

This graph shows ten and thirty year US Treasury Bond rates versus the S&P500 from 1995 to today.
Click for full size image

For current quotes and charts, see: 
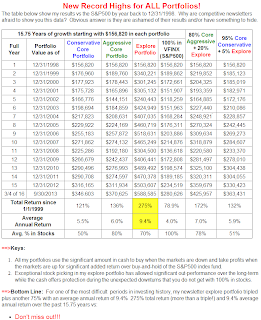
This table shows my newsletter "Core and Explore Portfolios" from 1998 through the end of Q3
Don't Miss Out!
Subscribe Now

and get the November issue for free
(Start subscription with December issue)


No comments:

Post a Comment

Followers - Click "follow" to get an email alert for new articles

Kirk Lindstrom's Investment Letter Performance