Don't Miss Out On Great Gains! - Best Investment Newsletter


Click for FREE sample of Kirk Lindstrom's Investment Letter

Don't miss out! Subscribe Now

google.com, pub-7001134751860982, DIRECT, f08c47fec0942fa0

Search For More

Showing posts with label Bonds vs S&P500. Show all posts

Saturday, June 16, 2018

Stock Market & Sentiment Update for June 16, 2018

We're nearly half way into 2018 and all stock markets have positive returns while the bond market, as measured by Vanguard's Total Bond Fund, is down 1.99% YTD.
Click the chart to see full sized images 
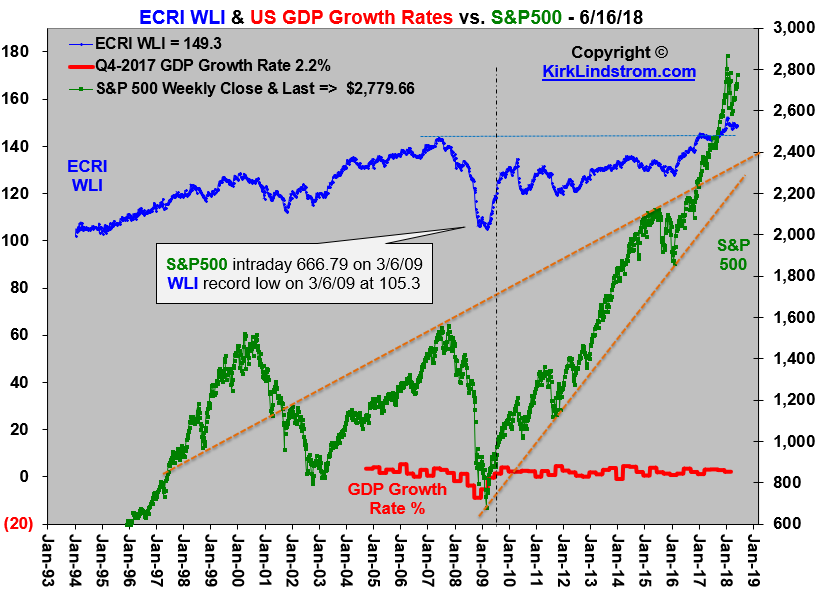
Market (charts) Update

Below are many of my favorite charts.  I explain most of the sentiment charts when I feature them in my newsletter.

Click "Follow" at the bottom of this blog to get FREE email notifications from Google's Blogger when I post new updates.




To get my "Special Email Alerts" and the "Auto Buy Sell Table" where I list ahead of time what stocks I will buy at what prices during declines and what I will sell during the advances. These buys and sells are at preset target prices you can use to set limit orders at your broker.
 Subscribe NOW  and get
the
 June 2018 
Issue for FREE!!!

Saturday, August 12, 2017

Graph: US Treasury Rates & SPY Yield

US Treasury bonds still have very low yields on an historical basis.  This chart shows US Treasury rates and the Federal Reserve's Fed Fund's Rate back to 1993.

Currently, the 10-year US Treasury bond has a 2.19% yield.


For comparison, the ETF for the S&P500, SPY, has a yield of 1.94%.

This week I used some of my profit taking from soaring technology and momentum stocks near their record highs to buy a stock that was well off it's record high with a dividend yield of nearly 4%.    

Kirk Lindstrom's Investment Letter Service:
  • Subscribe to my newsletter service NOW and get the August 2017 Issue for FREE!   Your 1 year, 12 issue subscription will start with next month's issue.
  • Get email alerts when I buy or sell securities for my explore portfolio
  • "Auto Buy" and "Auto Sell" levels set ahead of time for target buy and sell levels for my securities.  This allows you to place "limit orders" with your broker in advance so you can go about your business.
  • All questions about what I write answered by Email.  If what I write is not clear to you, just ask! 


Thursday, November 21, 2013

Graph 10 & 30-Yr T-Bonds vs S&P500

This graph shows ten and thirty year US Treasury Bond rates versus the S&P500 from 1995 to today.
Click for full size image

For current quotes and charts, see: 
This table shows my newsletter "Core and Explore Portfolios" from 1998 through the end of Q3
Don't Miss Out!
Subscribe Now

and get the November issue for free
(Start subscription with December issue)


Followers - Click "follow" to get an email alert for new articles

Kirk Lindstrom's Investment Letter Performance
