Don't Miss Out On Great Gains! - Best Investment Newsletter


Click for FREE sample of Kirk Lindstrom's Investment Letter

Don't miss out! Subscribe Now

google.com, pub-7001134751860982, DIRECT, f08c47fec0942fa0

Search For More

Showing posts with label CPC Put Call Ratio. Show all posts

Thursday, February 09, 2023

Kirk Lindstrom's Sentiment Charts

  🐂📈Kirk Lindstrom's Investor Bull/Bear Sentiment Charts for 2/9/23 📉🐻

Reminder, you can subscribe or follow this feed and get sent emails by Google when I post new charts and articles. Just click "Follow" below.

II Investors Intelligence & AAII (American Association of Individual Investors) Sentiment Updates

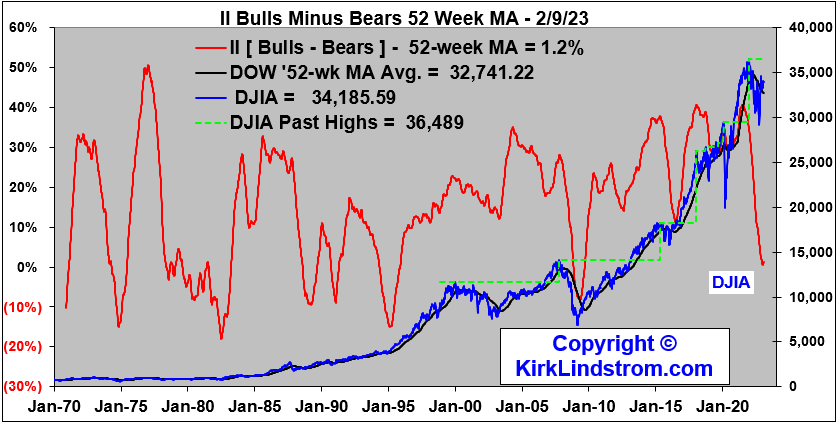
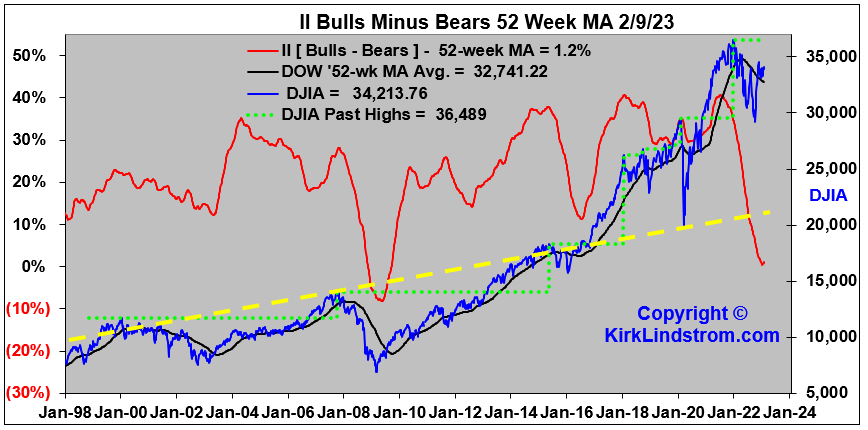
II Bulls and Bears Sentiment Graphs

  • % Bulls = 48.6
  • % Bears = 25.7.8
Note how the 52-week moving average has turned up on the first four long-term II Sentiment graphs.


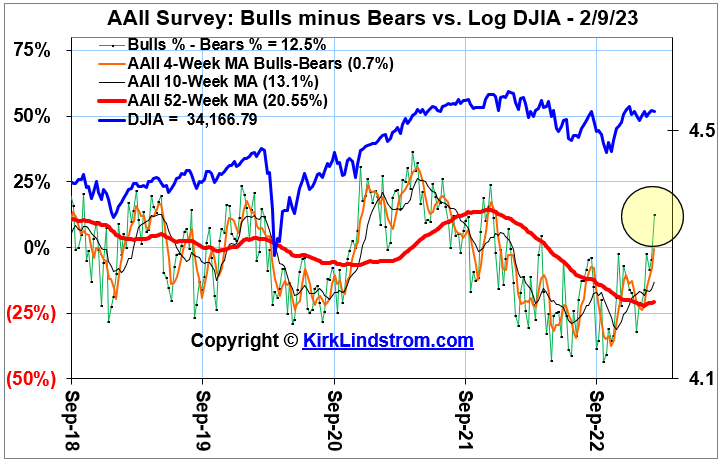
AAII Bulls and Bears Sentiment Graphs: The AAII Investor Sentiment Survey measures the percentage of individual investors who are bullish, bearish, and neutral on the stock market for the next six months.
As of   2/9/23, the AAII members are:
  1. Bullish: 37.5%
  2. Neutral: 37.5%
  3. Bearish: 25.0%
  4. Current Data from https://www.aaii.com/sentimentsurvey 

Graphs of the American Association of Individual Investors (AAII) Bulls Minus Bears Sentiment Indicator vs the Dow:


CPC Put:Call Ratio:

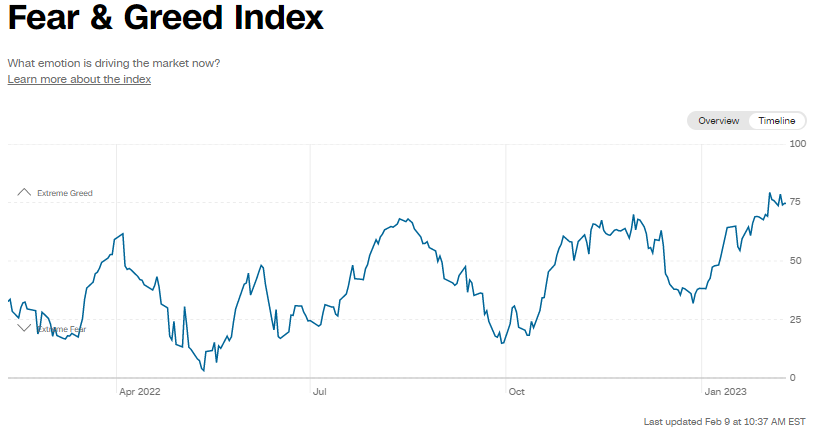
CNN Fear and Greed Index

More Information : These charts are covered on page 6 of my newsletter with updates during the year for what the different types of sentiment charts mean to me. This blog is an easy place to give my subscribers updates of charts too numerous to add each month to the newsletter but they might find worthwhile. And for others... they can window shop or ignore as it suits them.
Kirk Lindstrom's Investment Letter
To see what stocks and ETFs are in my portfolio and get a full list of on my price targets to both take profits or buy more:
 Subscribe NOW  and get
the
 February 2023 
Issue for FREE!!
(If you mention this ad)

Thursday, March 05, 2020

Investor Sentiment Charts for March 5, 2020

At the end of February the Stock market, as measured by the Dow, S&P 500, the NASDAQ and the Russell 2000, was down double digits from recent record highs.  Yesterday it was up some from those lows.  

Investor sentiment was extremely bullish as the stock market was making those record highs but now it is much subdued with some readings at extremely bearish levels. 

As of 8:30 AM PST today (3/5/20) all four markets are down 1% to 10% with my Newsletter Explore Portfolio down 2.9%.

Market Update for Wednesday March 4, 2020
Market Graph for Thursday March 5, 2020:
Market Update for Friday February 28, 2020


Fear & Greed Index for Thursday March 5, 2020
Fear and Greed Index vs S&P 500:

DJIA vs Oscillators 

2CS-p

II Investors Intelligence Bulls vs Bears

AAII Survey: Bulls minus Bears vs. Log DJIA

CPC Put/Call Ratio


Kirk Lindstrom's Investment Letter
Don't miss out!


x

Saturday, November 02, 2019

Investor Sentiment Charts for November 2, 2019

The Stock market, as measured by the S&P 500 and the NASDAQ, is at a record high.  As you would expect, investor sentiment has recovered quite a bit from its recent lows with the short term "Fear and Greed Index" now in rated as "Extreme Greed."  Many of my longer-term sentiment charts remain well below excessive optimism.

Market Update for Friday Nov. 1, 2019
Fear and Greed Index
Fear and Greed Index vs S&P 500:


Investors Intelligence Bulls / (Bulls+Bears) vs S&P 500 Weekly Close

Put:Call Ratio:
DJIA vs Oscillators 

2CS-p

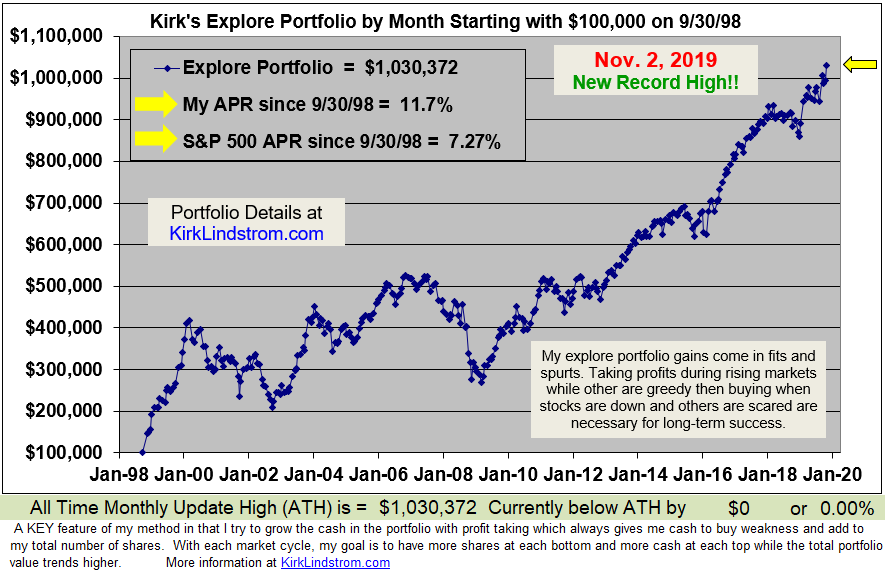
New Record High for My Explore Portfolio!   I've taken profits and now have my Explore Portfolio at WX% in Stocks and YZ% in Fixed Income.  Subscribe now to find out what I hold.


Kirk Lindstrom's Investment Letter
Don't miss out!


Thursday, October 10, 2019

Investor Sentiment Charts for October 10, 2019

The markets are just off record highs yet investor sentiment is quite bearish.  This is great news for contrarian investors.

This table shows the S&P 500 is only 2.9% below its record high,  the Russell 2000 small cap index is 14.7% off its record high while the Dow and Nasdaq markets are somewhere in between these two.
Market Data for 10/10/19
Market Comparison
Market Sentiment Charts for 10/10/19:

This CPC chart is one of my favorites for aiding me buy and sell around my core positions in addition to the limit orders I have for each stock in my newsletter.  That is I will add or subtract to positions and send out "Special Alert Emails" notifying my subscribers when this CPC and some of my other sentiment charts (not all published below) say it is time.


AAII Survey: Bulls minus Bears vs. Log DJIA


Dow vs proprietary "Oscillators" that also give me help knowing when to add or subtract from my Explore Portfolio positions.


TD: Timer Digest ST (1-yr) Bulls - Bears vs. S&P 500
10/10/19 Close


Once a month in my newsletter on page 6 I update one or more of my sentiment charts and discuss in more detail what they mean to me.  Send for a free sample to see what it looks like.


Kirk Lindstrom's Investment Letter
Don't miss out!
 Subscribe NOW

and get the October 2019 Issue For Free!


Followers - Click "follow" to get an email alert for new articles

Kirk Lindstrom's Investment Letter Performance