Don't Miss Out On Great Gains! - Best Investment Newsletter


Click for FREE sample of Kirk Lindstrom's Investment Letter

Don't miss out! Subscribe Now

google.com, pub-7001134751860982, DIRECT, f08c47fec0942fa0

Search For More

Showing posts with label Dow Mojo Chart. Show all posts

Thursday, March 02, 2023

Kirk's Dow vs Oscillators Graphs

 Kirk's Graphs of DJIA vs Oscillators for 3/2/23
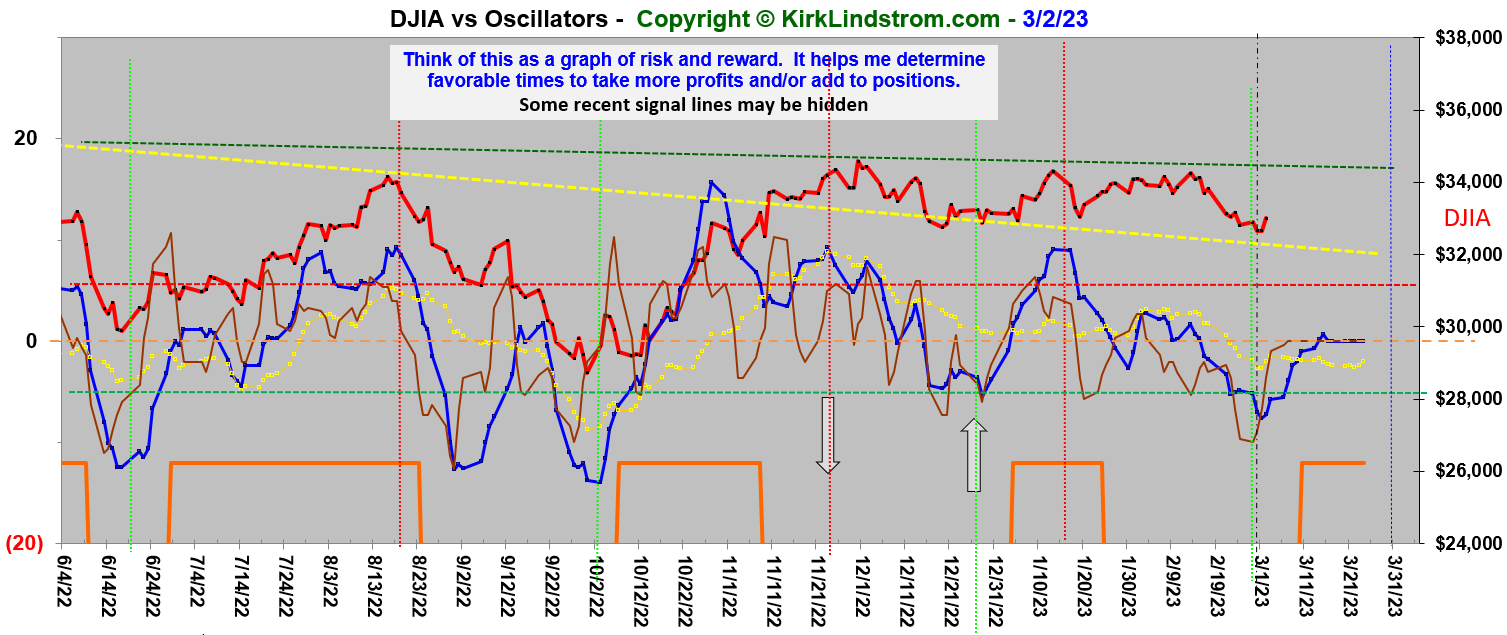
Click graphs for full size images


A few other timing charts

CPC Charts:
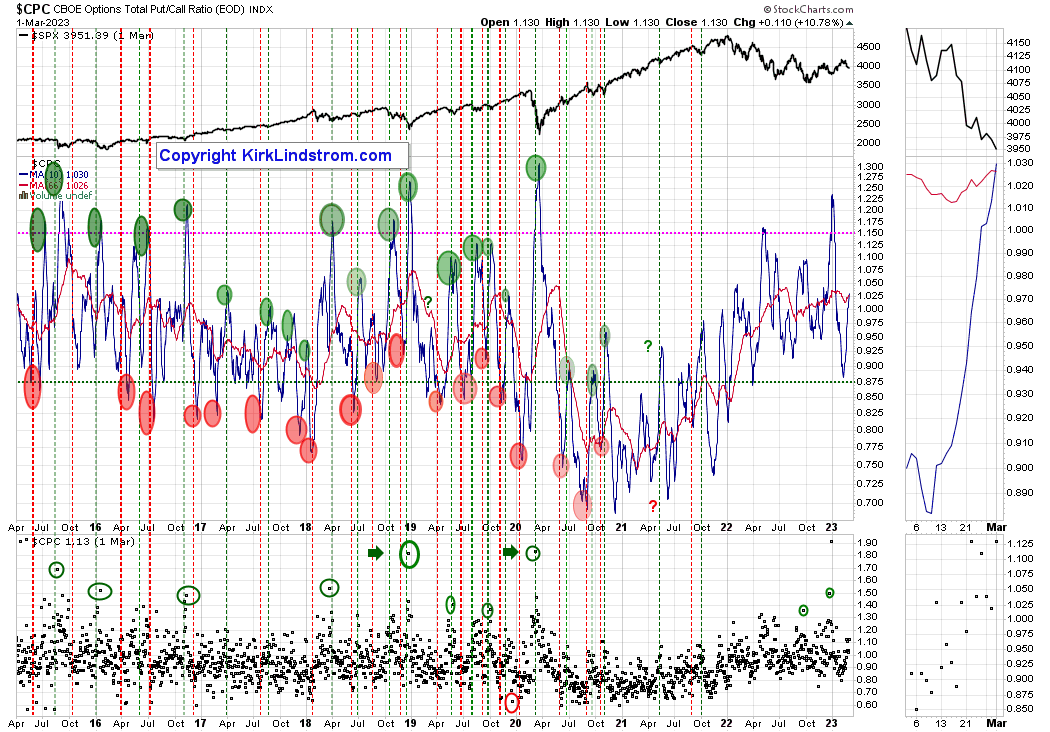

More Sentiment Information : Sentiment charts are covered on page 6 of my newsletter with updates during the year for what the different types of sentiment charts mean to me. This blog is an easy place to give my subscribers updates of charts too numerous to add each month to the newsletter but they might find worthwhile. And for others... they can window shop or ignore as it suits them.

Bradley Bradley Siderograph:
Kirk Lindstrom's Investment Letter

To see what stocks and ETFs are in my portfolio and get a full list of on my price targets to both take profits or buy more:
 Subscribe NOW  and get
the
 February 2023 
Issue for FREE!!
(If you mention this ad)

Reminder, you can subscribe to this feed for free to get sent emails by Google when I post new charts and articles. Just click "Follow" below.

Friday, September 23, 2022

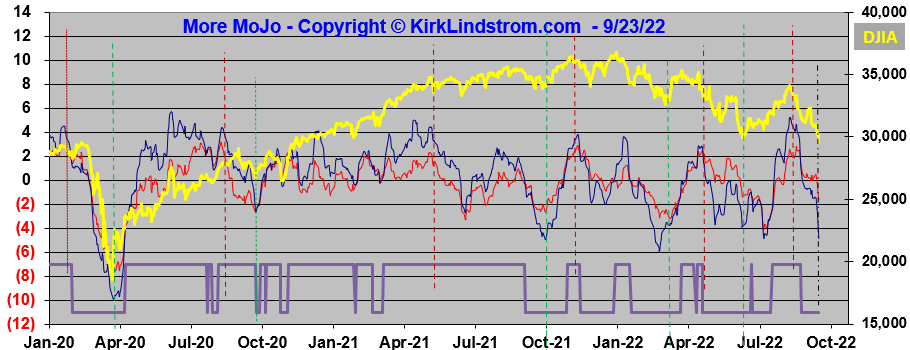
Kirk's Dow MoJo and Oscillator Charts

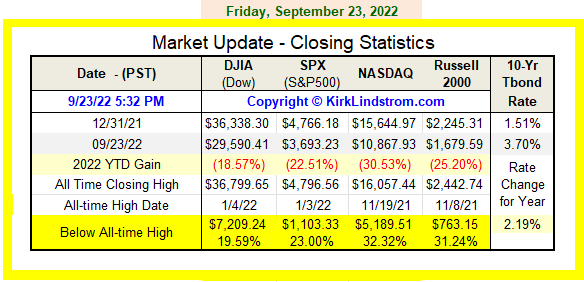
Today, September 23, 2022, the Dow Jones Industrial Average closed below its June low.  The Dow is lower today than before the COVID-19 pandemic began. 

These charts are best viewed full screen with an HD monitor.  

Kirk's Dow MoJo Chart 


Kirk's Dow vs. Oscillators Long-term Chart


Kirk's Dow vs. Oscillators Short-term Chart


Market Update


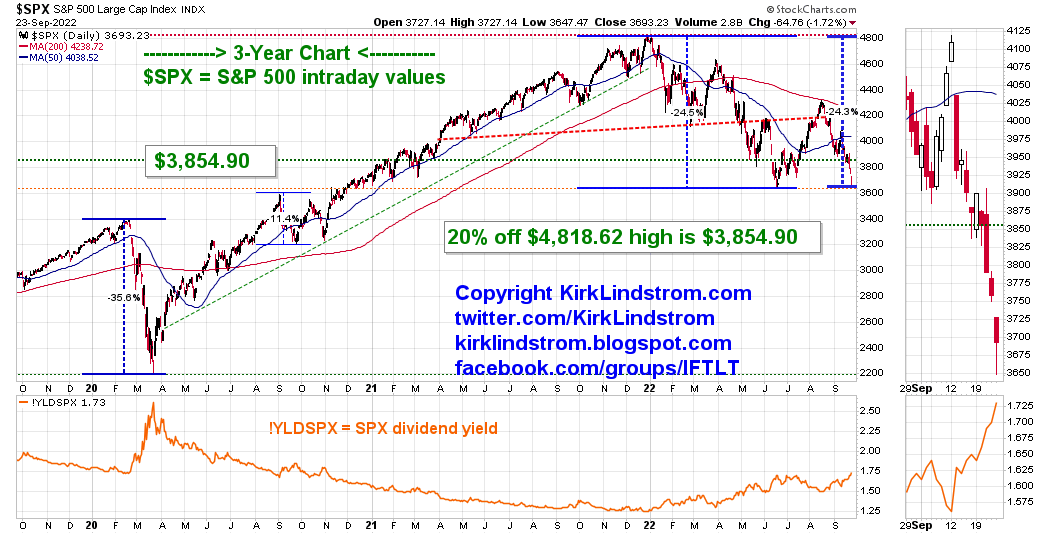
On an intraday basis, the Dow has given up all gains since it made a record high just before the pandemic began.


The S&P 500 has done a little bit better


Even though I've won many market timing awards, I'm not a big market timer... I do take profits when markets are setting records and have bought back shares near the lows of every major decline.  This helps me "ratchet up my cash" so the portfolio is less volatile, holds gains and outperforms in the long-term from both this "timing" as well as individual stock selection.

Kirk's Explore Portfolio 
Don't trust anyone who doesn't show drawdowns in their portfolios. Most people won't even show you their newsletter performance vs the S&P 500 over time for obvious reasons.

Kirk Lindstrom's Investment Letter

To see what stocks and ETFs are on my buy list and what are my price targets:
 Subscribe NOW  and get
the
 September 2022 
Issue for FREE!!!
(If you mention this ad)

More Articles by Kirk Lindstrom:
Let me know if you have issues reading these charts and I'll try to compress them in an update of this article.

Followers - Click "follow" to get an email alert for new articles

Kirk Lindstrom's Investment Letter Performance