Don't Miss Out On Great Gains! - Best Investment Newsletter


Click for FREE sample of Kirk Lindstrom's Investment Letter

Don't miss out! Subscribe Now

google.com, pub-7001134751860982, DIRECT, f08c47fec0942fa0

Search For More

Showing posts with label ESI Economic Sentiment Indicator. Show all posts

Thursday, August 08, 2019

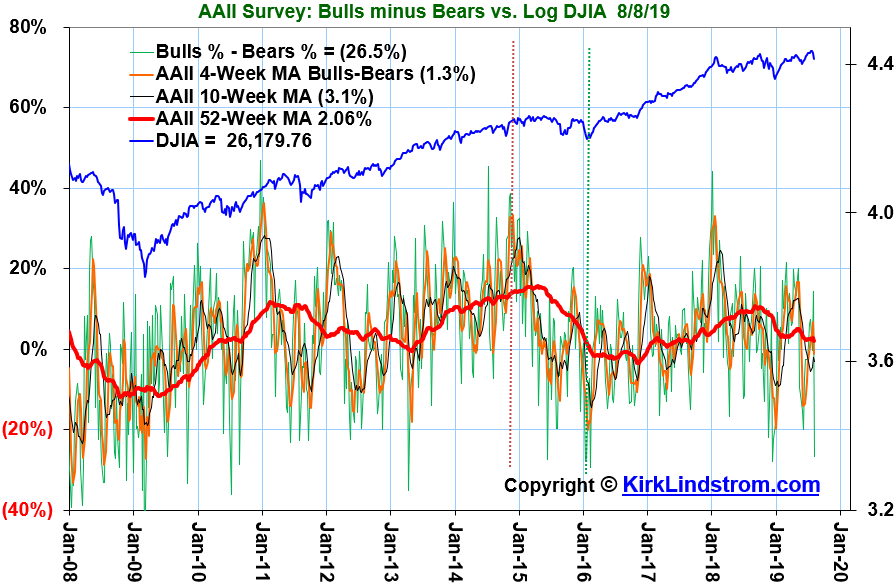
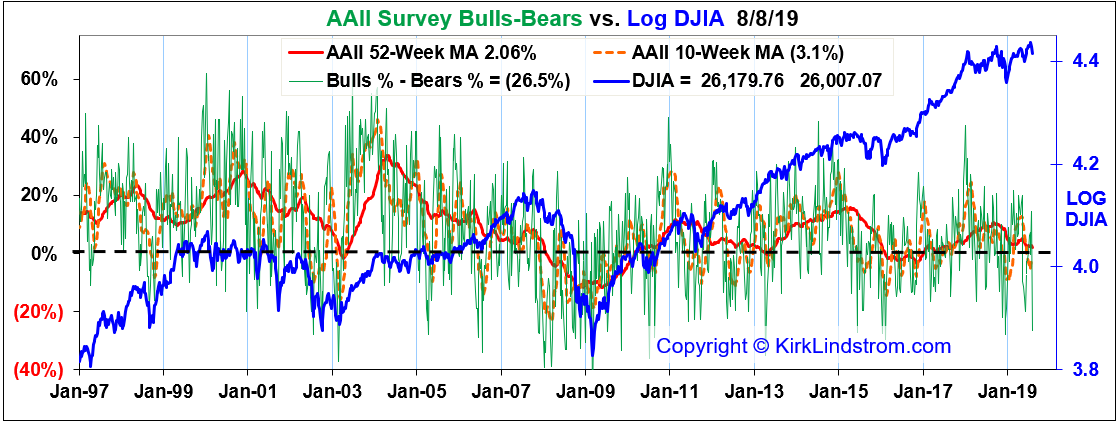
AAII Bulls Minus Bears vs DJIA Survey Data and Graphs for 8/8/19

The AAII Investor Sentiment Survey measures the percentage of individual investors who are bullish, bearish, and neutral on the stock market for the next six months.

As of 08/08/19, the AAII members are:
  • Bullish: 21.66%
  • Neutral: 30.15%
  • Bearish: 48.20%
Below are some of my charts showing this data over time.


Kirk Lindstrom's Investment Letter
Don't miss out!
 Subscribe NOW

and get the August 2019 Issue For Free!


Compare my results to SPY with Dividends reinvested:


More Information
  • Charts of the AAII (American Association of Individual Investors) Bulls minus Bears Index versus the market are key sentiment indicators for stock market technical analysis.  Contrarian theory states the time to buy is when fear and pessimism are at a maximum since this usually occurs near market bottoms. 
  • The AAII Investor Sentiment Survey measures the percentage of individual investors who are bullish, bearish, and neutral on the stock market for the next six months . AAII is the "American Association of Individual Investors." For the survey, Individual members of the AAII are polled on a weekly basis. Only one vote per member is accepted in each weekly voting period. The AAII reports the weekly results at https://www.aaii.com/sentimentsurvey/
  • A contrarian is a person with a preference for taking a position opposed to that of the majority view prevalent in the group of which they are a part of.

Tuesday, December 03, 2013

Dow Jones Economic Sentiment Indicator vs S&P500

Today the Wall Street Journal released their monthly reading of the DJ Economic Sentiment Index.  Below is my graph showing a plot of the Dow Jones Economic Sentiment Indicator versus the S&P500.
DJ Economic Sentiment Index Rises to 51.5 in November   
The U.S. economy in November showed few negative signs from the government shutdown that occurred in October, according to a survey of newspaper stories on U.S. economic activity released Monday.
 “The ESI has been picking up since its modest late-summer pullback, suggesting steady positive momentum in the U.S. economy into the yearend, boding well for the November payrolls report,” says Alen Mattich, “Money Talks” columnist at Dow Jones Newswires. 
 “But the positive news doesn’t suggest the sort of economic strength that would make the Federal Reserve hurry to trim its asset purchase program,” Mr. Mattich said.

Here is another very interesting chart:


About the DJ Economic Sentiment Index:

The economic sentiment indicator is designed to project the health of the U.S. economy by analyzing coverage of 15 major American newspapers, using a proprietary algorithm to look for positive and negative sentiment about the economy in every article.

The ESI is reported on a scale of 0 to 100; higher numbers represent increasingly positive sentiment. Dow Jones selected the 15 newspapers used to compile the indicator because they include extensive original reporting on economic issues. They are also geographically diverse and represent eight of the 10 largest metropolitan areas in the U.S.


Kirk Lindstrom's Investment Letter
==>   My returns by year  &  New Record Highs <==
 This table shows my newsletter "Core and Explore Portfolios" from 1998 through the end of Q3

Don't Miss Out!
Subscribe Now

Followers - Click "follow" to get an email alert for new articles

Kirk Lindstrom's Investment Letter Performance