Don't Miss Out On Great Gains! - Best Investment Newsletter


Click for FREE sample of Kirk Lindstrom's Investment Letter

Don't miss out! Subscribe Now

google.com, pub-7001134751860982, DIRECT, f08c47fec0942fa0

Search For More

Showing posts with label REITs. Show all posts

Friday, September 12, 2008

REIT Real Estate Investment Trust Update

Real Estate Investment Trusts (REITS) have had a nice, 20% gain off their 2008 lows, but they remain 30% below their 2007 highs, set at the beginning of the REIT bear market.

Click charts courtesy of stockcharts.com to see full size images
For long-term REIT investors, REITs have been great relative to stocks. The graph above clearly shows that despite being 30% off their peak, REITs are still up about 200% from early 2000 when the S&P500 was about 20% higher than it is today. (More S&P500 charts)

Disclaimer: In 2001 I added REITs to my "Kirk's Investment Newsletter" core portfolios to diversify into what I thought was an under valued asset class relative to stocks and bonds. Click for more information and a free sample.

Perfect Market Timing:

A perfect market timer, something that does not exist, or even a very good market timer would have sold equities in late 1999 or early 2000 and bought REITs, gold, oil (Crude Oil Charts) or a general commodities fund. All have been great investments relative to stocks.


The best most of us can hope for is to recognize under valued asset classes before they take off so we can add them to our diversified portfolios.

Are REITs a good buy now? It is hard to say. They are still up 200% from early 2000 so they are by no means cheap. The chart below shows two possible very bullish developments are in the works.

Click chart to see full size image
  1. Breaking above the 200-day-moving-average (DMA) is one key sign a new bull market is possible. If this 200 DMA, currently at 886, becomes support, rather than resistance, then that is bullish.

  2. The inverse-head-and-shoulder pattern developing is very bullish if the dashed red resistance line is broken with volume.
Until either happens, the REIT index remains in a bear market the trend down.

Summary:

Hard assets like land, real estate and gold have been great investments. Have they run their course? Are stocks so out of favor now with investors that they are great values? I am interested in what do you think.

Disclaimer: I personally own REITs and SPY (SPY is the ETF for the S&P500.) I also follow both in "Kirk's Investment Newsletter" . Click for more information and a free sample.

Saturday, May 24, 2008

Stock Market Returns After Oil Prices Double in a Year or less

As of Friday's close, oil prices are up 103% in the last year. Investments that have done well with rising oil prices were correctly predicted in the book "The Oil Factor."

==> More Oil Price Charts <==


I was given the book, "The Oil Factor" back in Feb 2004 to review and perhaps add it to my recommended reading list. I liked the book so I had it on my recommended reading list for several years and I recommended it in my writing.

In "The Oil Factor," authors Stephen and Donna Leeb said if oil doubles in any 12 month period, then the best the markets have done 18 months later is a 4% gain and the worst is a 27% loss. Here are more 18 month S&P500 market returns over the next 18 months after the specified oil price changes:

Oil prices (red)& the S&P500 (1973-2003)
12 month price change: S&P500 18 months later
Oil up >100%: -27% to +4%
+50 to 100%: -11% to +17%
*25 to 50%: -7 to +25%
0 to +25%: -3 to +21%

The Leebs predicted higher oil prices and inflation were in our future, suggested the overall stock market could see trouble making large gains and suggested some investments they thought would do well with oil prices going higher and higher. They even suggested that gold could reach $1000 from its then price in the low $400s! (See Ch 12: "We even think it could reach $2,000)


"The Oil Factor: Protect Yourself AND PROFIT from the Coming Energy Crisis"
by Stephen and Donna Leeb
(Feb 2004)

Worth the price of the book for the historic data in a bar graph on pg 17, Ch2.

Their recommended assets included energy stocks, that included REITS for inflation and Warren Buffett's BRKA, have done quite well.

Obviously, the oil companies and gold have been great investements since their book was published in Feb. 2004.

I made good gains buying GeoGlobal Resources (GGR $3.27) in 2004 between $0.95 and $2.25. GeoGlobal is a Canadian natural gas driller operating in India. I took massive profits in 2005 selling most of my shares all the way up to the mid teens ($13.65) before GGR collapsed so I got my energy profits front-loaded (I took enough profits to buy a Prius or two) but the slow, steady gains in the energy stocks the Leebs recommended in their book have done great also.

Note: I have recently started to repurchase shares in GGR with the most recent newsletter and personal purchases on 4/2/08 at $2.65. (GeoGlobal discovered the largest natural gas field in deep water off the shores of India. The stock soard on the news. Delievery to customers was delayed significantly so the price collapsed back to prediscovery levels, where I hope it is an incredible bargain.)

I also own and have recommended REITS as a core position in "Kirk Lindstrom's Investment Newsletter" since early 2001. REITS have done very, very well as an inflation hedge. Vanguard shows $10,000 invested in their REIT index fund on 1/1/2001 is now worth about $30,000.

The above chart doesn't show the dividends reinvested. REITs currently pay an effective yield of 4.15%. For the last 5 years, VGSIX has averaged 18.17% a year through 4/30/08!

Now we should read:

The Coming Economic Collapse: How You Can Thrive When Oil Costs $200 a Barrel
by Stephen Leeb and Glen Strathy
(February 21, 2007)

Product Description: Stephen Leeb shows how hard times can be a boon for smart investors. As the world faces an energy crisis of unprecedented scope, renowed economist Stephen Leeb shows how surging oil prices will contribute to an economic collapse. With meticulous research and analysis, Leeb shows that due to strong competition from India and China, prices could soon double, a cost for which most countries and investors are ill-prepared. Now, in this groundbreaking book, Leeb not only shows how this crisis will affect consumers, but how savvy investing can turn these dire times into financial gain.

He was right, oil prices did double and the S&P500 has struggled.

Click to view the full sized chart showing the price of oil plotted against the S&P500 from 1990 through Friday May 23, 2008.

To find out how I've profited greatly from these difficult market conditions, subscribe to "Kirk Lindstrom's Investment Newsletter" today!

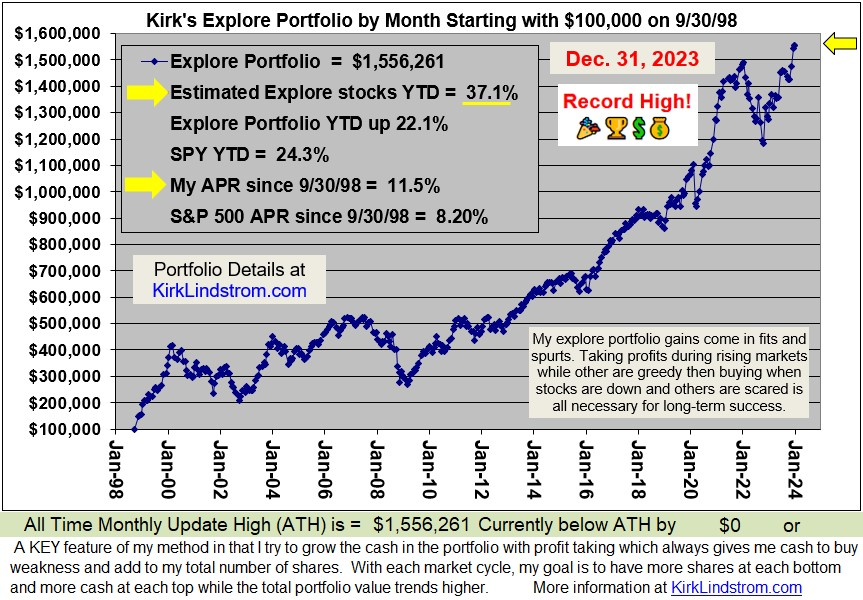
  • Since 1/1/1999 through 6/30/08 my "explore" portfolio is up 175% while the S&P500 is only up 20% and Warren Buffett's Berkshire Hathaway is only up 71%

  • Subscribe TODAY and get the September 2008 issue for FREE!

  • Newsletter (pdf) Story about my success

    Don't delay!

        Followers - Click "follow" to get an email alert for new articles

        Kirk Lindstrom's Investment Letter Performance