
 Using Intraday prices:
Last Market High 10/11/07 at 14,279.96and
Last Market Low 06/27/08 at 11,214.37
Current DJIA Price 11,215.51
Decline in Pts 3064.45
Decline in % 21.5%
Max Decline 21.5%
Using closing prices:More DJIA Charts
Date of last high 10/09/07
Last Market High 14,164.53
Date of last low 07/02/08
Correction Low 11,215.51
Decline in Pts 2949.02
Decline in % 20.8%
- This means the correction from high to low has been 21.5% and we are currently 21.5% off the peak.
- The decline in the DOW off the high on a closing basis has been 20.8%
When measured in ounces of Gold, the DOW has been in a secular bear market since peaking in late 1999.

A chart of the DOW Jones Industrial Average (DJIA) priced in gold shows the markets are not as healthy as one might think due to the decline of the US dollar.
- Back in 1999, it took 45 ounces of gold to buy the DJIA.
- Today it only takes 12.05 ounces of gold to buy the DOW!
Cutting the Fed Funds target rate from 6.50% in January 2001 to 1.0% in June 2003 may have inflated the US stock market out of its bear market when priced in dollars but it had consequences that we are feeling today.
Cutting interest rates to get the US out of a recession may have worked but the inflation in commodities and devaluation of the US dollar it caused has caused pain for the US consumer. This pain is often blamed on president Bush who took office just as the DOW/Gold ratio broke out of the "symmetrical triangle" pattern, explained below.
More, older Dow/Gold Charts courtesy of www.kitco.com and www.marketoracle.co.uk

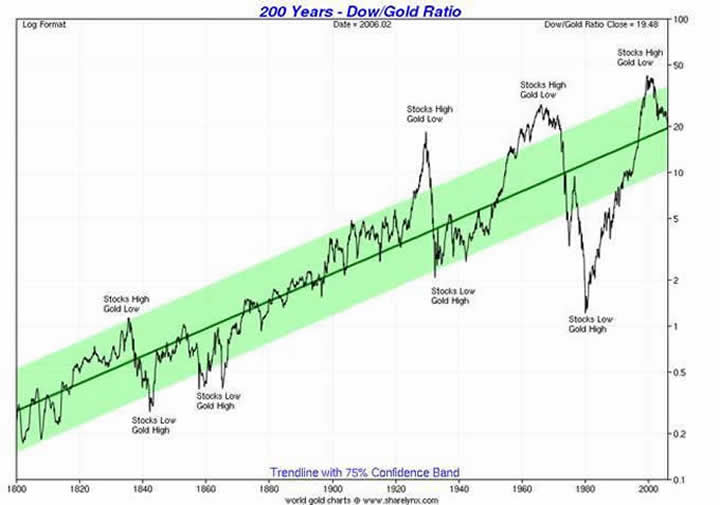
With the DOW:Gold ratio now at 12, it is trading at the bottom of the green zone in the second chart.
More on "Symetrical Triangle" chart patterns:
 The Bible for technical analysis, Technical Analysis of Stock Trends, by Robert Edwards and John Magee, says about 75% of symmetrical triangles are continuation patterns and the rest mark reversals. This book makes a great Father's Day Gift!
The "return to the apex" of the Gold/DOW ratio in late 2001, early 2002 confirmed the technical breakdown of this chart pattern.
For more information, read chapter eight "Important Reversal Patterns - The Triangles."

To find out how I've profited greatly from these difficult market conditions, subscribe to "Kirk Lindstrom's Investment Newsletter" today!
- Since 1/1/1999 through 6/1/08 my "explore" portfolio is up 199% while the S&P500 is only up 31% and Warren Buffett's Berkshire Hathaway is only up 91%
. - Subscribe TODAY and get the July 2008 issue for FREE!


 kirklindstrom.com
