
AAII Bulls Minus Bears vs DJIA Survey Data and Graph for 12/5/2013
The AAII Investor Sentiment Survey measures the percentage of individual investors who are bullish, bearish, and neutral on the stock market for the next six months. AAII is the "American Association of Individual Investors." For the survey, Individual members of the AAII are polled on a weekly basis. Only one vote per member is accepted in each weekly voting period. The AAII reports the weekly results at http://www.aaii.com/sentimentsurvey/.
As of 12/04/13, the AAII members are:
- Bullish: 42.64%
- Neutral: 29.81%
- Bearish: 27.55%

Charts of the AAII (American Association of Individual Investors) Bulls minus Bears Index versus the market are key sentiment indicators for stock market technical analysis. Contrarian theory states the time to buy is when fear and pessimism are at a maximum since this usually occurs near market bottoms.
More Information
- A contrarian is a person with a preference for taking a position opposed to that of the majority view prevalent in the group of which they are a part
- More about Technical Analysis & Sentiment Indicators
- Follow Sentiment on Facebook at Investing for the Long Term.
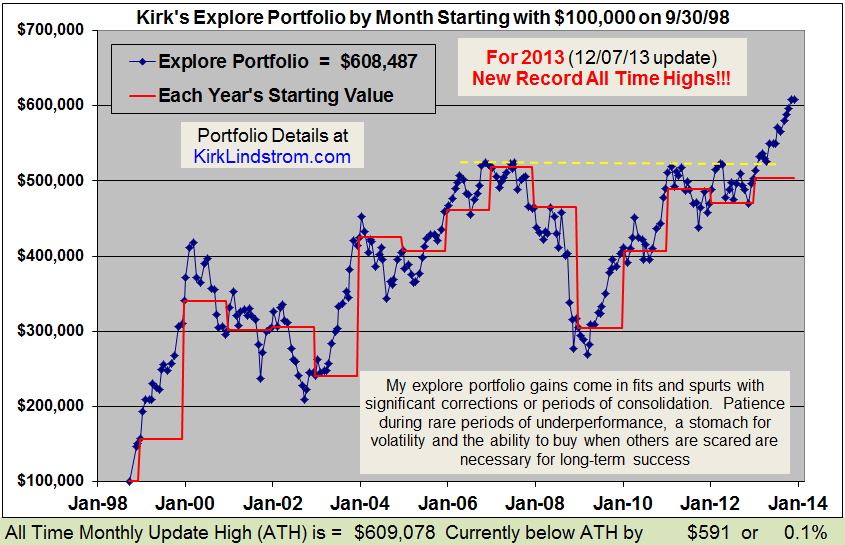
Kirk Lindstrom's Investment Letter
This table shows my newsletter "Core and Explore Portfolios" from 1998 through the end of Q3
Don't Miss Out!


 kirklindstrom.com

No comments:
Post a Comment