Don't Miss Out On Great Gains! - Best Investment Newsletter


Click for FREE sample of Kirk Lindstrom's Investment Letter

Don't miss out! Subscribe Now

google.com, pub-7001134751860982, DIRECT, f08c47fec0942fa0

Search For More

Friday, January 31, 2014

CPI Inflation In Japan Nears Target

Core inflation in Japan, which excludes fresh food prices, rose to a fresh five-year high of 1.3% year-over-year in December 2013 from +1.2% in November. This was above the consensus estimate of 1.2%.

Overall inflation increased to 1.6% from 1.5%.  

CPI is heading towards the Bank of Japan's target of 2% but the Japanese government wants businesses there to increase wages in order to solidify the rise in inflation.

More at:


“Consumers will be hit in the pocket from rising prices and the upcoming sales-tax hike,” said Masamichi Adachi, a senior economist at JPMorgan Chase & Co. in Tokyo. “The onus is now on companies to convert their profits into wage increases and capital spending.”
BOJ Inflation Target is 2.0%
The core consumer price index has reached the BOJ’s median estimate of 1.3 percent for the fiscal year starting in April and is more than halfway to its 2 percent target adopted in January last year. When the BOJ unveiled stronger stimulus in April, the central bank said it aimed to hit the goal in about two years. 

Read Watch the Red Lines: Dow, NASDAQ & S&P500 Resistance and Support


Tuesday, January 28, 2014

Fear & Greed Index Recovering

CNNMoney has a sentiment index called the "Fear & Greed Index."   Here is a snapshot of the index for today.
This index is a summation of seven indicators explained in detail here

  1. Stock Price Momentum: The S&P 500 versus its 125-day moving average
  2. Stock Price Strength: The number of stocks hitting 52-week highs and lows on the New York Stock Exchange
  3. Stock Price Breadth: The volume of shares trading in stocks on the rise versus those declining.
  4. Put and Call Options: The put/call ratio, which compares the trading volume of bullish call options relative to the trading volume of bearish put options
  5. Junk Bond Demand: The spread between yields on investment grade bonds and junk bonds
  6. Market Volatility: The VIX, which measures volatility
  7. Safe Haven Demand: The difference in returns for stocks versus Treasuries
"For each indicator, we look at how far they've veered from their average relative to how far they normally veer. We look at each on a scale from 0 - 100. The higher the reading, the greedier investors are being, and 50 is neutral.

Then we put all the indicators together - equally weighted - for a final index reading."


With the index starting to move higher after sharp decline below 40, it is possible the current market correction is about over.


Make sure to read "Timer Digest Market Timer of the Year Awards


Don't Miss Out!
Subscribe To my newsletter today
and get the January 2014 issue for free
(Start subscription with February issue)


Friday, January 17, 2014

Timer Digest Market Timer of the Year Awards

I am pleased to announce that "Kirk Lindstrom's Investment Letter" did very well according to the January 2, 2014 issue of "Timer Digest."  This is the annual issue where Timer Digest announces their 2013 Timers of the Year for stocks and bonds.

Awards for Kirk Lindstrom's Investment Letter for 2014
  • Timer Digest #1: tied for first place as "Bond Timer of the Year" (2013)
  • Timer Digest #1: tied for first place "Top Ten Timers" (Stock Market) for past 3 months (9/30/13 to 12/31/13)
  • Timer Digest #2: tied for second place for "Top Ten Timers" (Stock Market) for 2013
  • Timer Digest #2: tied for second place for "Top Ten Timers" for past 6 months (6/28/13 to 12/31/13)
Awards for Kirk Lindstrom's Investment Letter for 2013
  • Timer Digest #8: tied for eighth place for "Top Ten Timers" (Stock Market)in 2012
Bond Timer of the Year!

 Top Stock Market Timers:

Don't Miss Out!

Subscribe To my newsletter today

and get the January 2014 issue for free
(Start subscription with February issue)


Cost of Super Bowl Ad

The Super Bowl is the most watch TV show ever.   From Almost All Tech Firms Passing On Super Bowl Ads This Year
Last year's Super Bowl had a U.S. TV audience of 108.4 million, making it the No. 3 most-viewed program in TV history. It trailed two earlier Super Bowls, 111.3 million viewers in 2011 and 111 million in 2010.
This means it gets a very good rate from advertisers who want to reach a large audience.  
The average price of a 30-second Super Bowl ad is $4 Million, up from $3.7M to $3.8M last year.
  • January 2013 Super Bowl ad cost $3.7M to $3.8M 
  • January 2014 Super Bowl average ad costs $4.0M
With the high cost of ads, companies put a lot of effort into making good ads.  As a result, some people say they watch the Super Bowl just for the ads.

Thursday, January 16, 2014

NNVC NanoViricides Soars After Tax Loss Selling Season Ends

One of my "Explore Portfolio" speculation stocks, NanoViricides (My charts at NNVC), is soaring again shortly after adding shares last year at $4.60 as part of my "year end tax loss selling play" where I try to buy or add to positions in stocks I think are making relative bottoms due to tax loss sellers, even those with short term losses.
NNVC Intraday Chart - Click for Full Size Image
For example, last year NNVC was the biggest gainer in my newsletter "Explore Portfolio" with a total gain for the year of 191.8%.  You might ask "why would a stock that nearly tripled have people selling it for a loss?"


The answer is easy.  Some jumped into the stock just after I took profits in my Explore portfolio at $7.25 before it came back to Earth.  At $4.60, the stock was down 37% from where I took profits, a good pullback to add shares and a significant loss for those looking to offset gains in their other stocks.


Recent Newsletter Trades for NNVC
Smart traders with a short term loss who plan ahead were probably going to sell a month or more before the year ended, so I was there on November 21, 2013 to take some of their shares.  They could then buy 31 days later at the end of the year when poor planners with short term losses would sell.
Don't Miss Out!
Subscribe To my newsletter today
and get the January 2014 issue for free
(Start subscription with February issue)

Not-so-smart traders with short term losses who DID NOT plan ahead waited until later in the year to sell the stock and then they will buy back 31 days later to avoid the IRS "wash sale" rules.

You can see on the top chart above that we got a better low for buying in November than in December, probably because the November tax-loss-sellers were buying shares back.  Now we can enjoy the run and hit my next newsletter explore portfolio profit taking level, listed on page 5 of my January 2014 Investment Newsletter.

Don't Miss Out!

Subscribe To my newsletter today
and get the January 2014 issue for free
(Start subscription with February issue)

Jim Cramer says Hewlett Packard HPQ is a Buy

Some people are getting bullish again for Hewlett Packard (HPQ Charts and Quote).  I still hold all shares that I bought at lower prices in 2012.  (I bought twice under $15 with my own money and added it to my newsletter at $14.50)

At the bottom of this article is an excerpt from my January Newsletter about HP showing its valuation metrics.
Don't Miss Out!
Subscribe To my newsletter today

and get the January 2014 issue for free
(Start subscription with February issue)
A little over a year ago I heard Jim Cramer on his show trash talk HP stock. It was one of the final straws on the Camel's back that convinced me it was time to buy again after more than a decade of selling.
I also bought my first ever shares for my newsletter portfolio with a buy under $15 and targets to add at a lower price. I probably wrote this article too soon as it didn't quite reach my next buy point before taking off
Yesterday I caught a bit of Cramer's show and he said HPQ was a buy:
"Hewlett-Packard has been going up quietly and slowly. Cramer would be a buyer rather than a seller."   
Cramer's Mad Money Recap - (1/15/14)
You gotta love it when someone changes direction on advice after a double.

HP looks terrible on valuation using growth since revenue and earnings are still falling, but it has a PE of only 7 so if Meg can steady the ship it could easily get a PE of 10 for a nice gain. Show some growth and it could double again for a PE of 14.


Don't Miss Out!
Subscribe Now

and get the January 2014 issue for free
(Start subscription with February issue)

HPQ Valuation Discussion from my Newsletter

Sunday, January 12, 2014

Investors Intelligence Sentiment vs S&P500

Investors Intelligence Survey Data of Bulls-Bears vs. Weekly S&P 500

The “Investors Intelligence Survey“ or IIS is one of the oldest weekly sentiment indicators used today. Charts of the Investors’ Intelligence Survey (IIS) “Bulls over Bulls plus Bears” versus the market are key tools for stock market technical analysis or sentiment. The IIS began in January 1963 by A.W. Cohen and has been published every week ever since.


Sentiment is down a bit from the high set last week.  

Chart of Investors Intelligence Sentiment Survey
Bulls / (Bulls+Bears) vs S&P 500
Click to view full sized then maximize window to see very large image
Note that high sentiment doesn't always mean a major market decline will occur.  For example, in early 2003 sentiment was at a similar very high level with the S&P 500 at 1,000.   Some market pundits said "buy on weakness" or look for a major correction to get back into the market yet my chart shows the market went up over 50% in the next few years without a major (over 15%) pullback. 

Of course, low sentiment is often a good indicator of great times to buy.  For example, in early 2009, the stock market was bottoming at 666 and sentiment had crashed so I was a buyer using cashed I raised near the top (pdf from newsletter) in 2007:
More info at Investors' Intelligence Sentiment Indicator

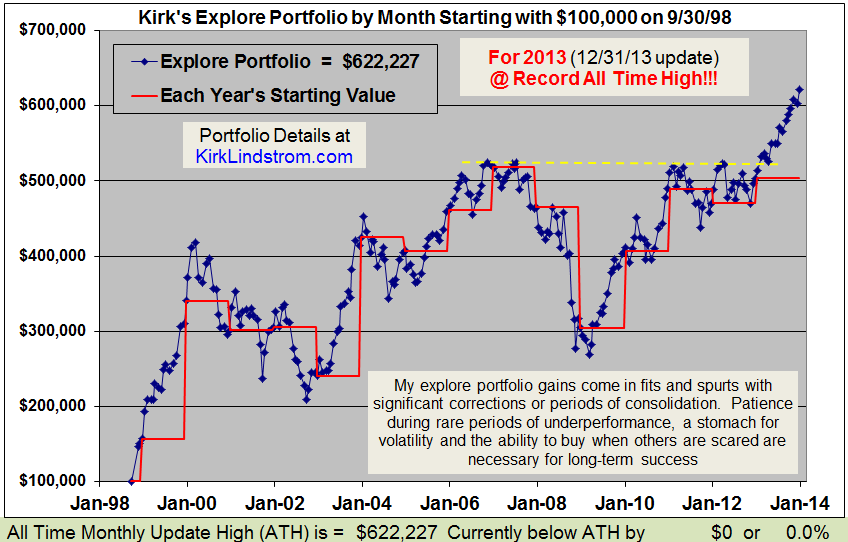
This table shows my newsletter "Core and Explore Portfolios" from 1998 through the end of 2013


Don't Miss Out!
Subscribe Now

and get the January 2014 issue for free
(Start subscription with February issue)


Followers - Click "follow" to get an email alert for new articles

Kirk Lindstrom's Investment Letter Performance