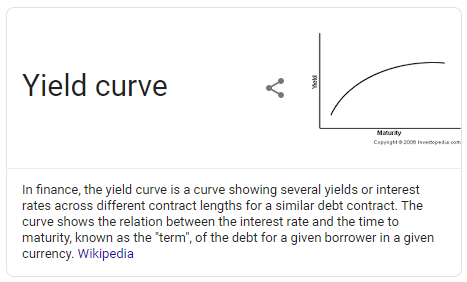
Many blame the stock markets' huge decline today on worries the yield curve (Figure 1) will fully invert. Inverted yield curves often, but not always, precede recessions. Just today the markets fell between 3.1% and 4.4% as Figure 2 below shows.
Generally the larger the inversion the higher the odds of a recession in the next year.
 |
| Fig 1 |
Today's Market Action
 |
| Fig 2 |
You can see from the graph above and table below that short term rates are higher than on 9/28/18 while intermediate to long term rates have fallen which is what has to happen before the yield curve inverts.
 |
| Fig 3 |
A "healthy" yield curve has rates increasing with term from one month to thirty years which we do not have now.
The yield curve is reflecting fear the "Trump Trade War" will push the country into a recession.
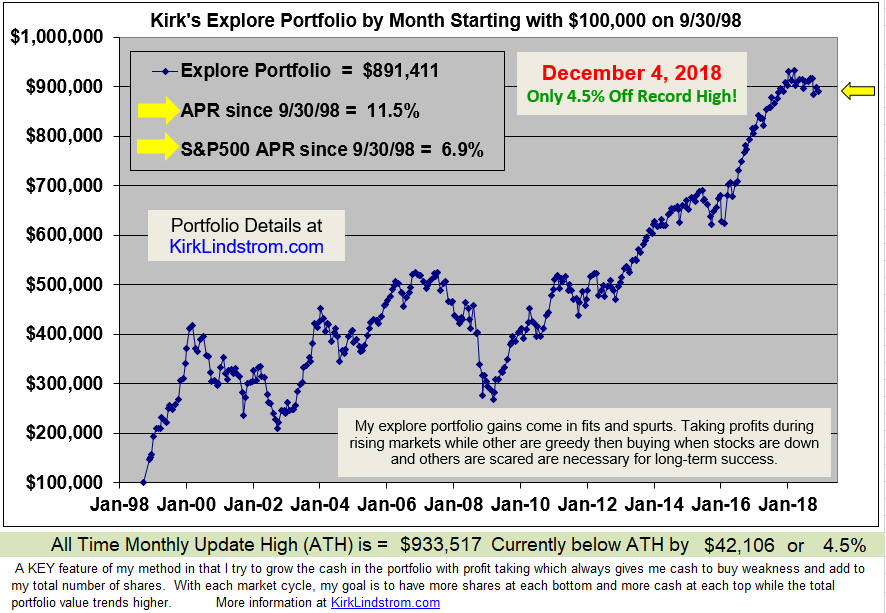
The Stock markets, as this table shows, are down between 6.7% and 15.0% below their recent, all time peak values with the Russell 2000 small cap index down the most!
 |
| Fig 5 |
Don't miss out on the next buy or sell alert!
 |
| Fig 6 |
 |
| Fig 7 |
Yield Curve Definition from Wikipedia


 kirklindstrom.com

No comments:
Post a Comment