Don't Miss Out On Great Gains! - Best Investment Newsletter


Click for FREE sample of Kirk Lindstrom's Investment Letter

Don't miss out! Subscribe Now

google.com, pub-7001134751860982, DIRECT, f08c47fec0942fa0

Search For More

Showing posts with label US Budget Deficit. Show all posts

Wednesday, June 12, 2024

Treasury Revenue Soars Again, but Deficit Grows by Another $347 Billion

Kirk's 6/12/24 Deficit Spending Update: For FY 2024 to date, total taxes and other revenues collected YTD are up 9.8% year-over-year.  The "good news" is SPENDING grew at "only" 8.0%!  This means the deficit is growing a "slower rate." 

The problem is during periods of economic growth like we've had for several years, we should be paying down debt by keeping spending below revenue, but we're doing the opposite.


After rising 10.3% in April 2024 vs April 2023, US Treasury revenue grew another 9.8% in May 2024 compared with May 2023.  The trouble is spending grew at 8.0% and remains well above revenue.  

Summary


Stated as a household budget by dividing by 40,000,000:


Inflation is a lazy government's way to raise taxes by pushing us into higher tax brackets while the spenders use borrowed money to buy vote for reelection without regard for what is good for the country.  Understanding this data is KEY but few take the time to bother.
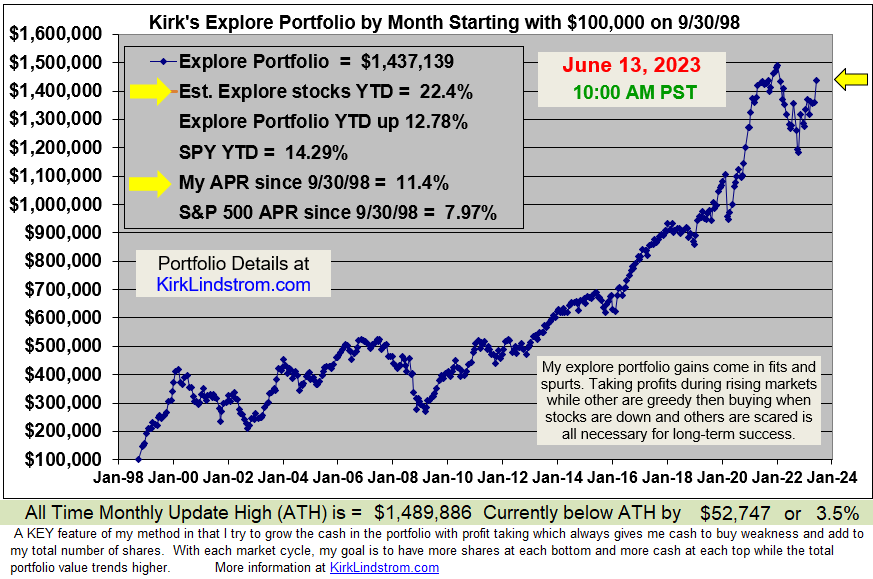

Kirk Lindstrom's Investment LetterTo see what stocks and ETFs are in my "Explore Portfolio" and get a full list of on my price targets to both take profits or buy more: 

Subscribe NOW  and get
the
 June 2023 
Issue for FREE!!


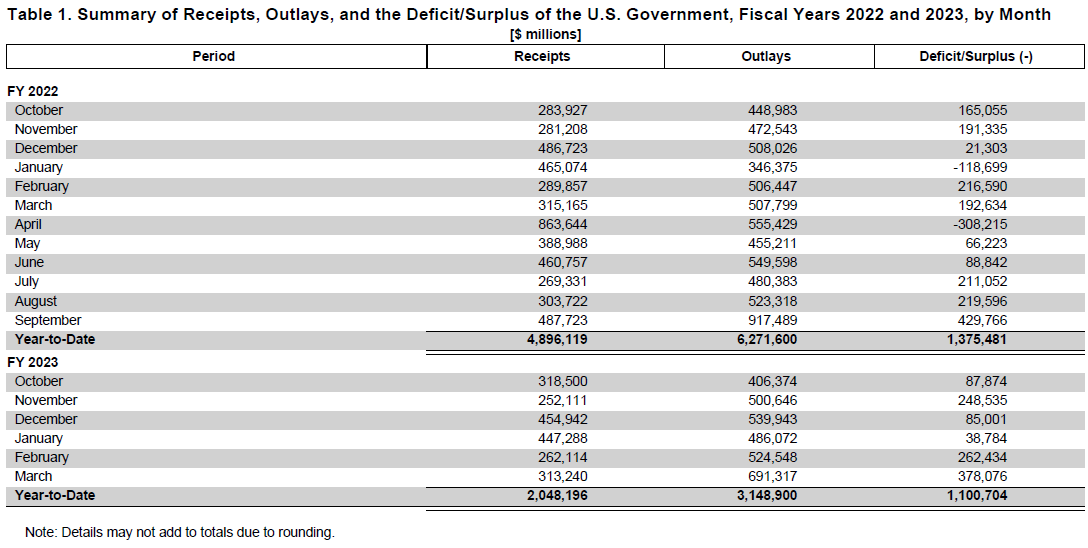
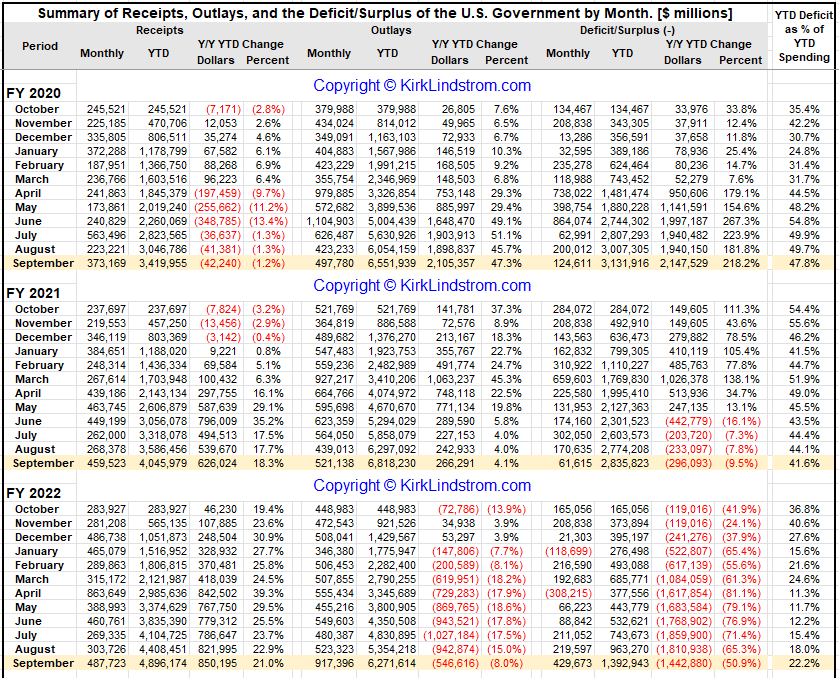
DATA FROM: https://www.fiscal.treasury.gov/files/reports-statements/mts/mts0524.pdf
x

Tuesday, June 13, 2023

Treasury Revenue Falls, Spending Rises and Deficit Soars

6/13/23 Updated Summary of Receipts, Outlays, and the Deficit/Surplus of the U.S. Government by Month.: 

Key Points:

  • For FY 2023, total taxes and other revenues collected YTD are down 11.3% year-over-year.  
  • Just as big a "problem" is SPENDING grew 9.4%!  
  • Spending is up about 5.4% above the 4.0% year over year CPI inflation rate reported this morning.
  • The deficit is up 27.1% in just a year!
This table shows a summary of receipts, outlays, and the deficit for the U.S. Government by Month.


To see what stocks and ETFs are in my "Explore Portfolio" and get a full list of on my price targets to both take profits or buy more:
 Subscribe NOW  and get
the
 June 2023 
Issue for FREE!!
(If you mention this ad)
x

Wednesday, April 12, 2023

Treasury Revenue Falls For Fifth Consecutive Month

I updated my revenue, spending & deficit table for the US Treasury with the latest numbers.

  • Revenue (taxes and fees) is not keeping up with inflation much less growing as you would expect if the economy was healthy
  • Spending is soaring, much like a recession.
  • Deficits, as a result, have already soared to $1.1 Trillion at the half way mark of fiscal 2023 while they didn't pass $1 trillion until the 12 month of fiscal 2022.
Clearly, with five months of declining treasury revenue which is mostly individual and payroll taxes, we are in a tax recession already.

With requirements for "Estimated Tax Payments" to be paid four times a year, this is usually a very "lumpy" series thus I add calculations to show how these data change for the same period in the prior year.  For example, April 2022 saw revenue increase by 96.6% as many tax payers paid their capital gains taxes on their fantastic 2021 gains.  What I look for is trends such as the current trend of Treasury Revenue falling month-over-month for five consecutive months despite inflation of over 5% during that period.  If we were to adjust the March 2023 reading by March's 5.0% inflation, "real revenue" collected by the Treasury fell by 5.6% which is hardly a healthy economy.


A healthy, growing US economy should have this revenue moving higher to match GDP growth, which is inflation adjusted, plus inflation. 


Selected excerpts from the Monthly Treasury Statement

Cumulative Receipts, Outlays, and Surplus/Deficit through Fiscal Year 2023


Note how this next graphic shows the March 2023 deficit is already larger than the August 2022 deficit:

Kirk Lindstrom's Investment Letter

To see what stocks and ETFs are on my buy list and what are my price targets:
 Subscribe NOW  and get
the
 April 2023 
Issue for FREE!!!
(If you mention this ad)

xxx

Friday, October 21, 2022

2022 Treasury Deficit Adds 1.4 Trillion Dollars - National Debt at $31.2 Trillion

I updated my revenue, spending & deficit table for the US Treasury.  Clearly tax collections continue to rise despite the lower corporate tax rate.  

  • The "problem" is SPENDING has gone up much faster than revenue.   
  • During fiscal 2022, total US Treasury revenue grew 21.0% to $4.9 trillion while spending fell only 8.0% to $6.3 trillion thus adding another $1.4 trillion to the deficit.   
  • The largest Outlay for September was for $449 billion for "Education" with Medicare and Social Security tying for 2nd and 3rd at "only" $104 billion each.   
Spending fell as the government isn't paying workers to not work and stay home to slow the spread of COVID-19. To get a better idea, below are some comparisons to fiscal year1999 before COVID impacted our economy.

Compare FY 2022 with FY 2019:
  • In FY 2019 before spending on COVID-19, the total deficit for the year was "only" $0.98 trillion, thus the deficit grew 40% while revenue collected from taxes grew!
  • Total Revenue in 2019 was $3.33T and total spending was $4.11T
  • Total Revenue in 2022 was $4.90T and total spending was $6.27T  
  • Between FY 2019 and FY 2022
    • Revenue grew $0.76T or 23%
    • Spending grew $2.16T or 53%


Receipts, Outlays, and Surplus/Deficit for September 2022

Receipts by Source: Outlays by Function:
Figure 2. Cumulative Receipts, Outlays, and Surplus/Deficit through Fiscal Year 2022


Kirk Lindstrom's Investment Letter

To see what stocks and ETFs are on my buy list and what are my price targets:
 Subscribe NOW  and get
the
 October 2022 
Issue for FREE!!!
(If you mention this ad)
US National Debt now exceeds $31 TRILLION dollars or $247,882 per taxpayer and $93,703 per person!  

US Debt table from https://www.usdebtclock.org/

Wednesday, February 12, 2020

US Treasury Revenue up 9.5% while Spending Soars 22.2% in January 2020

My table below shows a "Summary of Receipts, Outlays, and the Deficit/Surplus of the U.S. Government by Month Through January 2020."  

Monthly US Treasury Statement Calculations

  • A staggering 22.1 cents of ever dollar spent so far in fiscal 2020 came from new borrowing!
Year over year change for January:
  • Monthly revenue (taxes, fees and tariffs) grew 9.5% over 2019
  • Monthly spending grew 22.2% vs 2019
  • The monthly deficit grew $32.5B vs falling $8.7B in 2019 
  • but year over year the total deficit grew 25.4%!!!

Some try to blame the Trump tax cuts on the deficit, but clearly the revenue collected is higher.  The reasons for higher revenues are:

  1. Lower tax rates for corporations gave them money to expand, pay raises, increase dividends.  For example, the Minimum wage in Google's home city Mountain View, CA is $15.65 per hour.  I've heard Walmart in Mountain View starts most workers at about $20 per hour if they have better skills and non-English speaking dishwashers.
    Higher dividends paid to shareholders means more income to stockholders that get taxed.
  2. Removing the deductibility of state income, property and sales taxes, which are very high in California, raised taxes on the wealthy in blue states. 
  3. Tariffs from the Trade war increase revenue. 
If any of the politicians were concerned about the deficits, they would speak of how they will lower spending or increase productivity in the business sector to attract even more high paying jobs to the US.


Don't miss out!Subscribe NOW and
get the February 2020 Issue for FREE!

Friday, May 10, 2019

April Treasury Revenue up 4.9% while Spending Soars 7.6%

My table below shows a "Summary of Receipts, Outlays, and the Deficit/Surplus of the U.S. Government by Month Through April 2019."  

Monthly US Treasury Statement Calculations
  • A staggering 20.6 cents of ever dollar spent so far in fiscal 2019 came from new borrowing!
Year over year change  for April:
  • Monthly revenue (taxes, fees and tariffs) grew 4.9% over 2019
  • Monthly spending grew 7.6% vs 2019
  • The monthly deficit fell 25.2% vs 2019 
  • but year over year the total deficit grew 37.7%!!!
Summary of Receipts, Outlays, and the Deficit/Surplus of the U.S. Government by Month. [$ millions]

The Monthly Treasury Statement summarizes the financial activities of the federal government and off-budget federal entities and conforms to the Budget of the U.S. Government.

FULL Year Summary:


FULL Year Summary Stated as a Family Budget:


You can never have too much data so I process the latest reports to see tax collections, spending and the official deficit behaves without "noise" from the obviously biased MSM "Main Stream Media."

Don't miss out!

And get the May 2019 Issue for FREE!

Wednesday, October 17, 2018

Tax Revenue Grows but 2018 Deficit Explodes on Higher Government Spending

The US deficit grew to $779 billion in fiscal year 2018, up 17% from fiscal 2017.  

If you check my table below, it shows receipts from taxes and tariffs grew 0.6%, 1.5% and 0.4% in 2016, 2017 and 2018.   Over the same period, government spending grew by 4.5%, 3.3% and 3.2% .  Clearly it is not the "tax cuts"  but the spending that caused the deficit to explode as the data clearly shows.


This is the largest deficit number since 2012. 

Can you imagine if your family spent like this?
Where the money came from and was spent:

In Fiscal 2018 [$ millions]:  
  • Receipts = $3,328,745 
  • Spending = $4,107,750 
  • Deficit = $779,005 

In Fiscal 2016 [$ millions]: 

  • Receipts = $3,266,775 
  • Spending = $3,852,421 
  • Deficit = $585,646 
Note how Corporate taxes fell by $95B between 2016 and 2018 while "trickle down" to the workers where the Payroll Tax (or OASDI and Medicare) grew $56B from $1,115B to $1,171B.  If you add in the gains in personal income taxes that grew $138B from $1,546B to $1,684B, you could say the total gain of $56B + $138B  or $194B in taxes from individuals more than made up for the lower taxes paid by corporations.  

 Subscribe NOW  and get
the
 October 2018 
Issue for FREE!!!

For more, read Final Monthly Treasury Statement of Receipts and Outlaysof the United States GovernmentFor Fiscal Year 2018 Through September 30, 2018, and Other Periods 

Monday, October 23, 2017

US FY 2017 Deficit - Summary of Receipts, Outlays & Deficit by Month Compared to 2016

This table shows a summary of receipts, outlays, and the deficit (and some months surplus) for the U.S. Government by Month. 

Roughly 16.7¢ of every dollar spent in FY 2017 was new debt!

So, does this table say our budget deficit issues are improving or getting worse?

(Click table to See Full Size Image)
Trump won the election in November 2016 but didn't have control of the budget until the January 20th Inauguration. Odd, why the huge slash in Y/Y spending during the first 3 months of FY17?

 #BlameTrump #BlameObama

Friday, October 14, 2016

2016 Budget Deficit Grew 33.8% over Fiscal 2015

If the economy is doing so well, why is government spending rising faster than tax collections?

Between fiscal 2015 and fiscal 2016
  • Collections by the US Treasury grew by 0.6% to $3.27 trillion
  • Spending by the US Government grew by 4.5% to $3.85 trillion
  • The US budget deficit grew by 33.8% or $587 billion 
Here is my breakdown of the data in table form to add numbers they don't like us to know.
Click for full size image
Total Federal Government Debt in 2016:  At the end of FY 2016 the gross US federal government debt is estimated to be $19.4 trillion, according to the fiscal year 2017 Federal Budget.  

October was the start of FY 2017 so here is an estimate of where the total national debt stands as of today:

You can check my numbers here at the Treasuries "Final Monthly Treasury Statement"
  • https://www.fiscal.treasury.gov/fsreports/rpt/mthTreasStmt/mts0916.pdf
This table adds a calculation for the monthly, rather than YTD change.

I have a hard time making the case our economy is "recovering" when government spending is growing faster than tax collections.  Your mileage may vary.

Kirk Lindstrom's Investment Letter:
Subscribe NOW & get the October 2016 Issue for FREE!!!


Monday, April 30, 2012

ECRI's WLI and Deficit Spending

ECRI's WLI Moves Higher; Q1 GDP Positive Due To Deficit Spending
For the week ending April 20, 2012:
  • WLI increased to 124.1, up 0.3 from the prior week's reading of 123.8.
  • WLI growth fell to a positive 0.6%, down from last week's reading of 1.2%. 
  • First estimate of Q1-2012 GDP Growth is only 2.2%
ECRI WLI & WLI Growth vs. US GDP Growth

GDP, WLI and Deficit Spending

As my graph above shows, GDP turned lower as you would expect with the lower WLI readings, but it remains firmly in positive territory. The US economy has not entered a recession but it is painfully low.
Actual GDP in Q1-2012 was $15.462 trillion compared to $14.868 trillion in Q1-2011. The difference is $594 billion, less than the current 6 month deficit of $779 billion I show in the second chart in the Seeking Alpha article "U.S. Borrows 53.7 Cents Of Every Dollar Spent In March." Clearly, we would be in a recession that ECRI predicted if not for deficit spending.

A "Failure of Leadership"
The fact that we are here today to debate raising America's debt limit is a sign of leadership failure. It is a sign that the US Government cannot pay its own bills. It is a sign that we now depend on ongoing financial assistance from foreign countries to finance our Government's reckless fiscal policies. Increasing America's debt weakens us domestically and internationally. Leadership means that, "the buck stops here.' Instead, Washington is shifting the burden of bad choices today onto the backs of our children and grandchildren. America has a debt problem and a failure of leadership. Americans deserve better. I therefore intend to oppose the effort to increase America’s debt limit. ~ Senator Barack H. Obama, March 2006

Tuesday, March 13, 2012

US Budget Deficit Rises to $4,088 per Worker!

Your share of the deficit up again. It is a scary number to calculate what the per capita share of the National Debt is per "worker" in the US is ... so I just calculated how much it went up in a few short months for this fiscal year.

Read my full article at Seeking Alpha Called:
U.S. Budget Deficit Rises Another $4,088 Per Worker

Is anyone ashamed of this? 
Do you feel right leaving this sort of debt to your children and grandchildren?

Followers - Click "follow" to get an email alert for new articles

Kirk Lindstrom's Investment Letter Performance